Creative Performance Score
Last updated
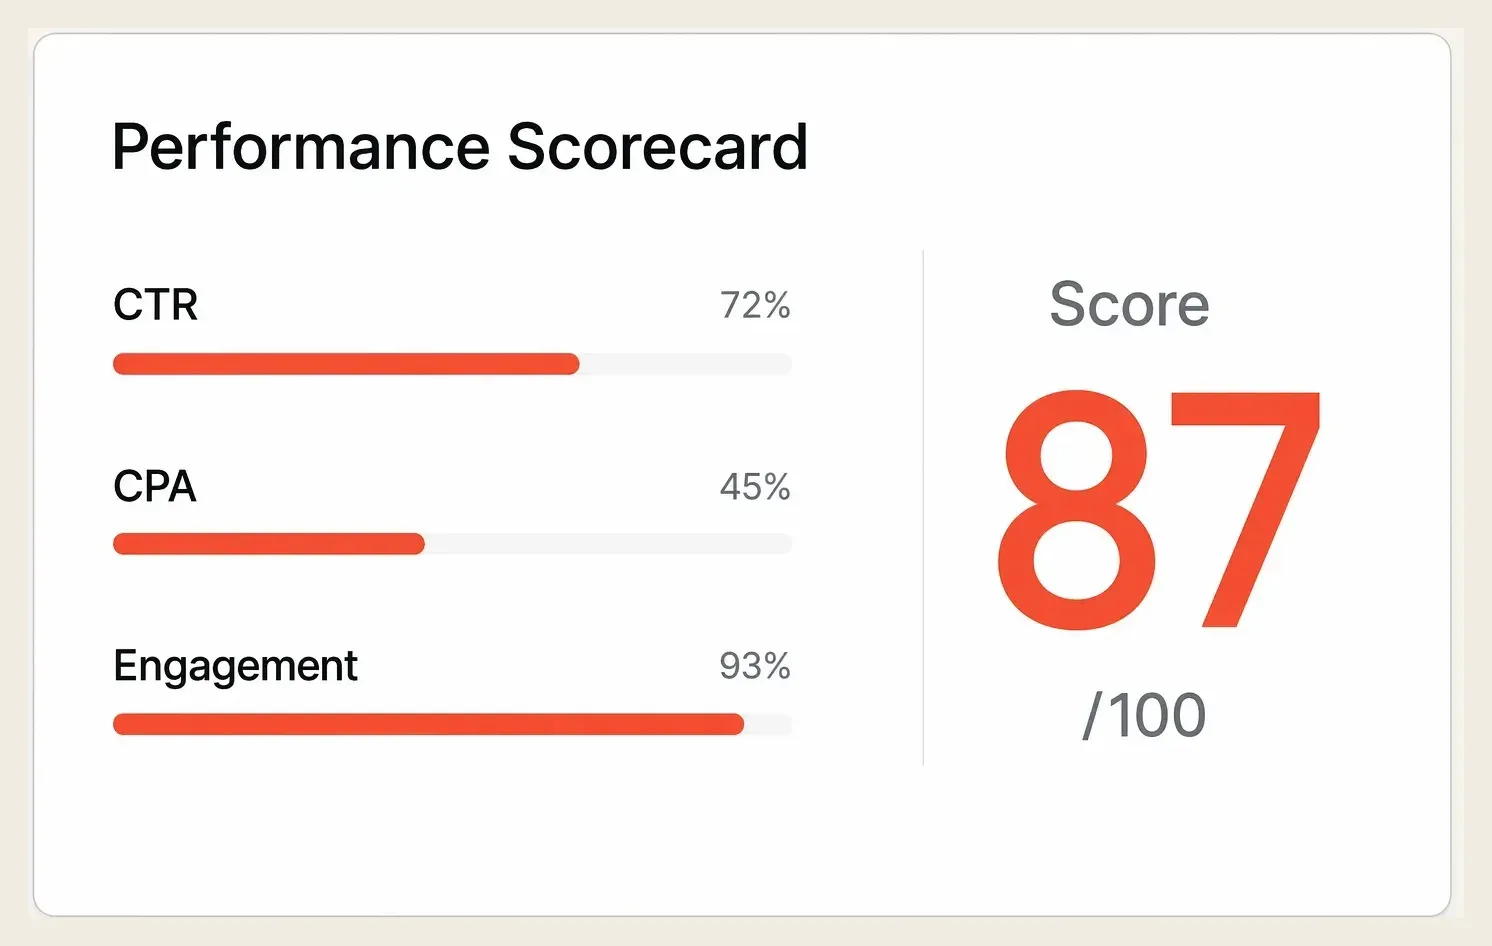
A Creative Performance Score synthesizes CTR, CPA, and engagement into one number that shows how well your ad creative performs. Learn how scoring works.
Creative Performance Score
A Creative Performance Score synthesizes CTR, CPA, and engagement into one number that shows how well your ad creative performs. Learn how scoring works.
Creative Performance Score is a single, standardized number (typically 0 to 100) that synthesizes multiple campaign metrics like CTR, conversion rate, engagement, and cost efficiency into one unified indicator of how well your ad creative is performing. Instead of juggling dozens of metrics across platforms, you get one score that instantly shows whether a creative is winning or needs work. It turns a messy spreadsheet of platform-specific numbers into a single decision: scale, optimize, or pause.
Why It Matters
When you are running 20, 50, or 100 or more ad variations, you cannot manually analyze every metric for every creative. Creative Performance Scores give you instant triage: which ads deserve more budget, which need optimization, and which should be paused. The score is especially valuable when presenting to stakeholders who want a simple answer to how our ads are performing without diving into platform-specific weeds.
The deeper reason it matters is speed of reallocation. In paid media, budget sitting behind a weak creative is budget not earning, and at scale that waste adds up fast. A single comparable score lets you move spend toward winners in hours instead of after a week of manual review. Given that creative drives around 56% of campaign performance according to Nielsen and Meta, a fast, fair way to rank creatives is one of the highest-leverage tools in the account.
How It Works
A Creative Performance Score is only as good as the logic behind it. Four mechanics turn raw metrics into a number you can act on.
- Multi-metric synthesis combines key indicators (CTR, CPA, conversion rate, engagement) weighted by your campaign objectives.
- Platform normalization adjusts for platform differences so you can fairly compare a LinkedIn ad to a Facebook ad on the same scale.
- Benchmark comparison scores creative against industry standards and your own historical performance to provide context.
- Threshold-based action enables rules like pause any creative below 40 after $500 spend, or scale creatives above 75, so the score drives decisions automatically.
A Real Example
A SaaS company running lead generation across Facebook, LinkedIn, and Google was drowning in metrics. Each platform had different benchmarks: a 3.2% CTR was excellent on LinkedIn but mediocre on Facebook, and an $85 CPL was great on LinkedIn but terrible on Facebook. They implemented a Creative Performance Score that normalized these differences and weighted conversions heavily (60%), CTR moderately (25%), and engagement lightly (15%).
Within two weeks, they identified that 12 of their 43 active creatives scored below 45 and were consuming 31% of budget while generating only 8% of leads. They paused those creatives and reallocated budget to the 8 ads scoring 80 or above. The result was a 47% reduction in average CPL without increasing total ad spend, all because they had a single metric to guide decisions instead of nine conflicting ones.
Common Mistakes
| ❌ Mistake | ✅ Better Approach |
|---|---|
| Using the same scoring formula for awareness and conversion campaigns | Weight metrics by campaign goal (awareness prioritizes reach and CTR, conversions prioritize CPA and ROAS) |
| Scoring creatives too early, before they have statistical significance | Wait for minimum thresholds (1,000 or more impressions, 20 or more conversions) before trusting the score |
| Comparing scores across completely different audiences and objectives | Compare creatives within the same campaign and audience context for a fair read |
How Hawky Helps
Hawky's Performance Agent calculates a Creative Performance Score for every ad in the account automatically, with weighting that adapts to each campaign's objective. It does not stop at the headline number. Through element-level analysis, it identifies which specific components (headlines, images, CTAs) are driving or dragging the score, so the account knows not just that a creative is weak but exactly why.
From there the Creative Agent acts on the signal, reading proven winners from FeatherDB and rendering improved variants. A score of 72 with a weak CTA becomes a fixed creative, not a note in a report saying the CTA could be better. The agents triage, diagnose, and rebuild, so a low score turns into action rather than another dashboard alert.
Frequently Asked Questions
What is a good Creative Performance Score?
On a 0 to 100 scale, creatives scoring 75 or above are typically strong enough to scale, the 45 to 75 band usually warrants optimization, and anything below 40 to 45 after meaningful spend is a pause candidate. Exact thresholds depend on how the score is weighted for your objective, so treat them as starting rules and tune to your benchmarks.
How is a Creative Performance Score calculated?
It combines several metrics, commonly CTR, conversion rate, CPA, and engagement, weighted by campaign objective, then normalizes for platform differences and compares against benchmarks. A conversion campaign might weight CPA and conversion rate heavily, while an awareness campaign leans on reach and CTR. The output is a single comparable number.
When can I trust a creative's score?
Wait for statistical significance before acting, generally at least 1,000 impressions and 20 or more conversions for a conversion campaign. Scoring a creative too early rewards or punishes noise rather than real performance. Premature scores are the most common reason teams pause an ad that would have won.
How is a Creative Performance Score different from creative intelligence?
A Creative Performance Score measures how an existing creative is doing, while creative intelligence is the broader practice of using data to predict and shape what creative to make next. The score is the diagnostic; creative intelligence is the strategy that uses it. The score tells you which ads to scale, and intelligence tells you what the next ones should look like.
Quick Takeaway
Creative Performance Scores synthesize multiple metrics into one standardized number (0 to 100) that shows how well your ad creative is performing, enabling faster decisions about which ads to scale, optimize, or pause without drowning in platform-specific metrics.
You are reviewing dozens of creatives by hand while budget hides behind the losers. Ready to hire your first AI performance team? Book Demo