Average ROAS for eCommerce: 2026 Benchmarks Every Media Buyer Needs

The average ROAS for eCommerce in 2026 is 2.87:1, meaning brands earn $2.87 in revenue for every $1 spent on advertising. But that number alone tells you almost nothing about whether your campaigns are working.
ROAS benchmarks shift dramatically based on your ad platform, product category, profit margins, and business stage. A skincare brand with 60% margins can scale profitably at 2:1. A dropshipper with 25% margins needs 4:1 just to break even. This guide breaks down the real eCommerce ROAS benchmarks by platform, ROAS by industry, and the factors that actually determine what "good" looks like for your business.
ROAS (Return on Ad Spend) is the revenue generated for every dollar spent on advertising. It is the most widely used metric for measuring ad campaign efficiency in eCommerce. The formula is straightforward: divide your ad revenue by your ad spend.
ROAS = Revenue from Ads / Ad Spend
If you spend $10,000 on Meta ads and those campaigns generate $40,000 in revenue, your ROAS is 4.0 (or 4:1). For every dollar you invested, you earned four back.
ROAS differs from profit. A 4:1 ROAS does not mean you quadrupled your money. It means you generated four dollars of top-line revenue per ad dollar, before subtracting product costs, shipping, platform fees, and overhead. That distinction matters more than most benchmark articles acknowledge.
Performance marketers use ROAS to compare campaign efficiency across platforms, creative variants, and audience segments. Media buyers use it to decide where to allocate budget. Finance teams use it to evaluate whether paid acquisition is sustainable at the current unit economics.
Understanding related metrics like cost per lead, click-through rate, and customer lifetime value alongside ROAS gives you a more complete picture of campaign health. ROAS in isolation can be misleading, which is why experienced media buyers treat it as one input among several. For a broader view of the metrics that matter, see mastering performance marketing: key metrics and tools.
The average ROAS across all eCommerce businesses in 2026 is 2.87:1. This represents a decline from previous years, driven by rising CPMs, increased competition for ad inventory, and ongoing attribution challenges from iOS privacy changes.
Here is a critical nuance most benchmarks skip: the median ROAS is only 2.04:1. That means half of all eCommerce businesses are operating below a 2:1 return. The average gets pulled up by high-performers, making it a misleading target for most brands.
Metric
Value
Average eCommerce ROAS (2026)
2.87:1
Median eCommerce ROAS (2026)
2.04:1
Year-over-year change (mid-market)
-9.07%
Year-over-year change (large brands)
-8.79%
Year-over-year change (small brands)
+16.51%
The trend story is notable. Mid-market and large brands saw ROAS decline roughly 9% year over year, consistent with Meta's own reported industry-wide drop in ad efficiency. Smaller brands bucked this trend with a 16.5% ROAS improvement, likely because they benefited from better creative iteration speed and less dependence on broad automated campaigns.
Seasonal swings compound the complexity. eCommerce ROAS typically peaks at 4-5:1 during Q4 (Black Friday through holiday season), drops to 2-2.5:1 in January and February, then stabilizes around 3-3.5:1 through summer. Planning your targets around an annual average without accounting for these cycles leads to bad budget decisions.
For brands budgeting on a quarterly basis, the gap between Q4 and Q1 can represent a 50-60% swing in return on ad spend. Flat monthly budgets fail to account for this, leaving money on the table during high-efficiency months and overspending during low-efficiency ones.
Different advertising platforms produce significantly different ROAS outcomes because they capture shoppers at different stages of intent. Google catches people actively searching for products. Meta interrupts people scrolling their feed. TikTok entertains first, sells second.
Google Ads
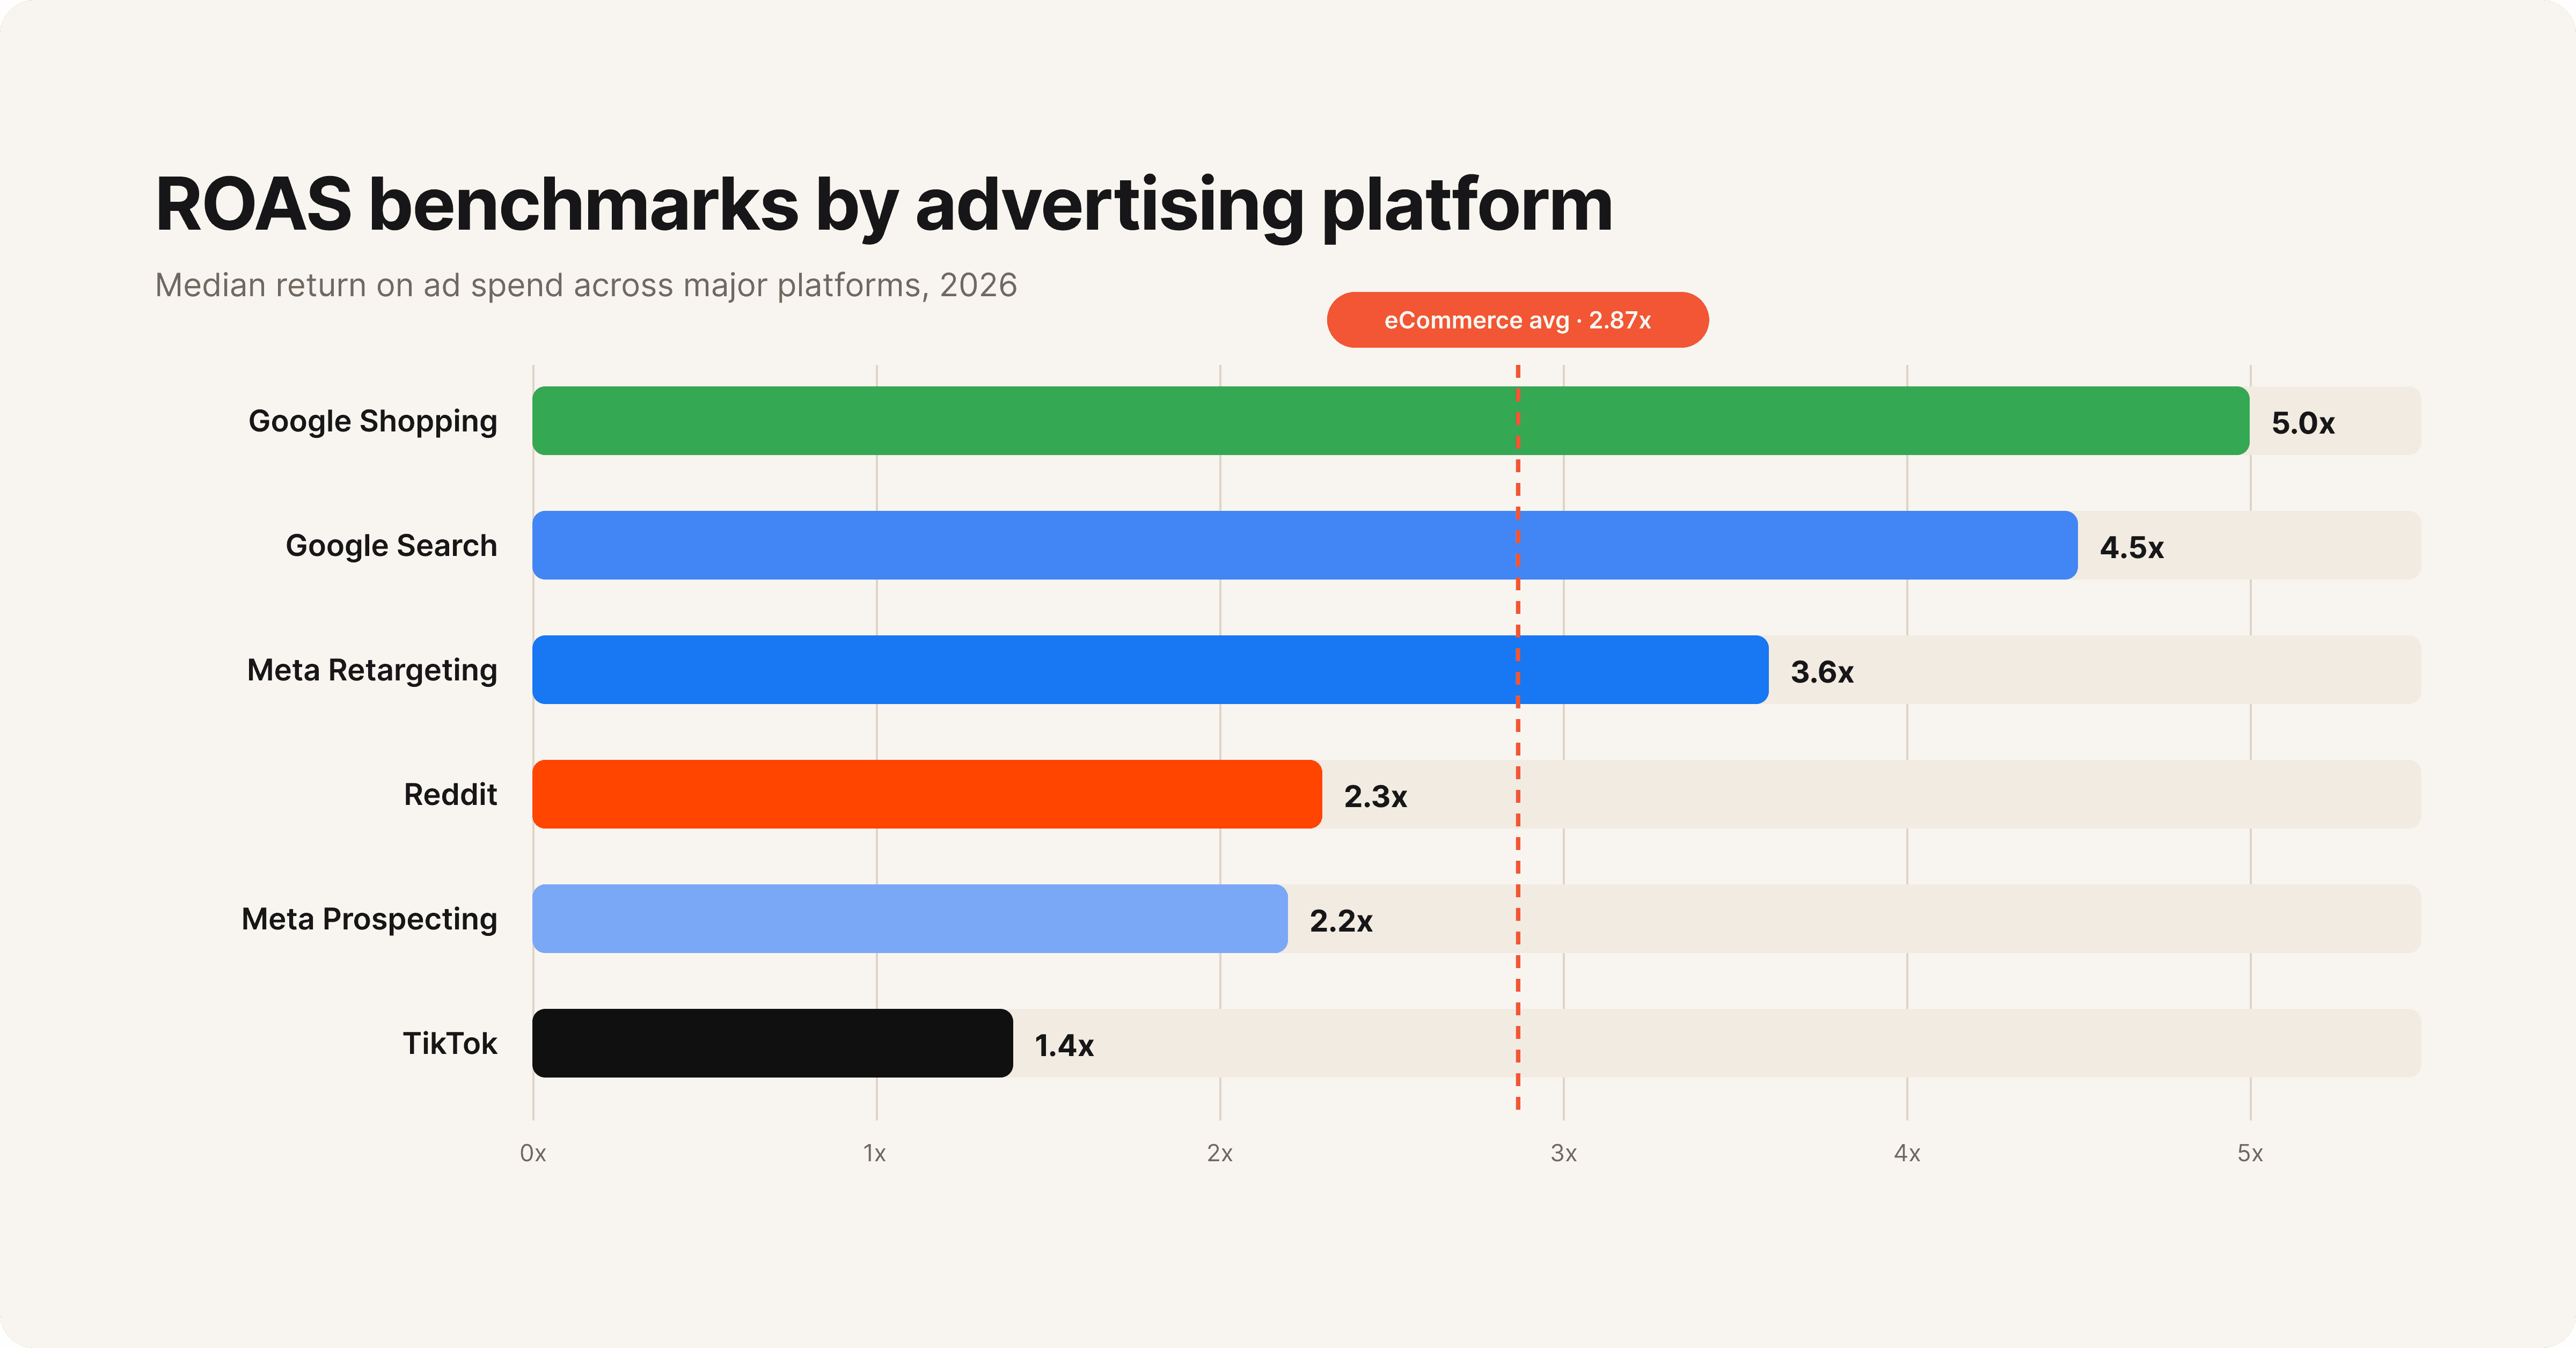
Google Ads ROAS leads eCommerce ROAS benchmarks with a median of 4.5:1 for Search campaigns, according to Google's own advertising benchmarks. Someone typing "buy running shoes size 10" has far higher purchase intent than someone scrolling Instagram. Shopping Ads perform similarly strong at 5.0:1, driven by visual product listings that appear at the exact moment of commercial intent.
Performance Max campaigns have become a major factor in 2026. These campaigns use Google's AI to serve ads across Search, Shopping, Display, YouTube, and Gmail simultaneously. Early data suggests Performance Max delivers 10-15% higher ROAS than standalone Shopping campaigns, though with less transparency into which placements drive returns.
The catch is scale. Google Search volume is finite. Once you have captured the high-intent queries in your category, growing spend means moving into broader match types, Display, or YouTube, all of which carry lower ROAS.
Meta Ads (Facebook and Instagram)
The average Facebook Ads ROAS for eCommerce sits at 2.2:1 for prospecting and 3.6:1 for retargeting. That gap is significant. Retargeting campaigns convert warm audiences (site visitors, cart abandoners, past purchasers) at much higher rates, inflating blended ROAS numbers in ways that mask true acquisition efficiency.
Advantage+ Shopping Campaigns (ASC) have become the default for most eCommerce advertisers on Meta, as detailed in Meta's business help center. Brands running ASC report 15-25% higher ROAS compared to manual campaign structures, largely because Meta's algorithm handles audience discovery and placement optimization with less signal loss.
B2C eCommerce ROAS on Meta follows a predictable seasonal pattern: 4-5:1 during Q4, 2-2.5:1 in January/February, and 3-3.5:1 through summer.
TikTok Ads
TikTok's median eCommerce ROAS of 1.4:1 looks weak on paper according to TikTok for Business benchmarks, but context matters. Beauty and personal care brands consistently hit 3.5:1 on TikTok because the platform's native content format (short-form video with creator-style production) aligns perfectly with product demonstration and impulse purchasing.
For higher-ticket items like electronics or furniture, TikTok typically underperforms at 1.0-1.5:1. The platform works best for visually compelling products under $75 that benefit from social proof and demo-style creative.
Reddit Ads
Reddit is the emerging platform story of 2026. Following a September 2025 algorithm overhaul, advertisers have reported average ROAS climbing from 2.3:1 to as high as 4.7:1 in certain verticals. CPMs remain lower than Meta ($0.50-$15.00 vs. Meta's $8-$20+ range), making it attractive for brands willing to invest in community-native creative.
Product category is one of the strongest predictors of ROAS by industry because it determines average order value, purchase frequency, margin structure, and buyer motivation. High-urgency categories with emotional buying triggers consistently outperform commoditized or low-margin segments.
Category
Average ROAS
Key Driver
3.71:1
High urgency, quality-driven parents
3.50:1
Gift-driven purchases, seasonal peaks
Sports and Fitness
3.20:1
Aspirational buying, strong visual creative
Health and Beauty
2.82:1
Repeat purchases, brand loyalty
Fashion and Apparel
2.60:1
Impulse buys, high competition
Home and Garden
2.40:1
Higher AOV offsets longer consideration
Electronics
2.10:1
Price comparison, thin margins
Healthcare/Supplements
1.80:1
Compliance restrictions limit creative options
Baby products lead at 3.71:1 because new parents are motivated buyers who prioritize quality and safety over price. They convert quickly, often on the first or second touchpoint, and are less likely to comparison-shop aggressively.
Healthcare sits at the bottom (1.80:1) largely due to advertising restrictions. Compliance requirements on platforms like Meta and Google limit the claims brands can make, reducing creative effectiveness and click-through rates.
Fashion and apparel (2.60:1) occupies an interesting middle ground. The category benefits from high impulse-purchase rates and visually strong creative formats, but intense competition drives CPMs up. Brands that differentiate through creative quality rather than bidding wars consistently outperform category averages. The same is true in health and beauty (2.82:1), where repeat purchase rates and subscription models can make a lower initial ROAS acceptable if lifetime value is factored in.
For a deeper look at how creative performance analysis impacts ROAS across categories, the pattern is clear: categories where visual creative matters most (baby, toys, beauty, fashion) reward brands that invest in creative testing and iteration.
A good ROAS for eCommerce is any ROAS above your break-even point that still allows for profitable scaling. For most businesses, that falls between 3:1 and 5:1. But "good" is entirely relative to your margin structure and growth stage.
Here is how ROAS targets typically break down by business context:
Business Context
Target ROAS
Rationale
Venture-funded startup (growth mode)
1.5 - 2.0:1
Prioritizing customer acquisition and market share over short-term profitability
D2C brand with 50-60% margins
2.0 - 3.0:1
Healthy margins allow profitable scaling at lower ROAS
Dropshipping (25-30% margins)
4.0 - 5.0:1
Thin margins require high efficiency to reach profitability
Mature brand (profit optimization)
4.0 - 6.0:1
Established customer base, focus on maximizing return
Subscription/LTV model
1.5 - 2.5:1
First-purchase ROAS is low, but lifetime value justifies acquisition cost
The most common mistake in ROAS benchmarking is treating a single number as a universal target. A 3:1 ROAS is strong for a brand with 65% gross margins and weak for a reseller operating at 20% margins. Your break-even ROAS (covered in the next section) is the only benchmark that actually matters for your business.
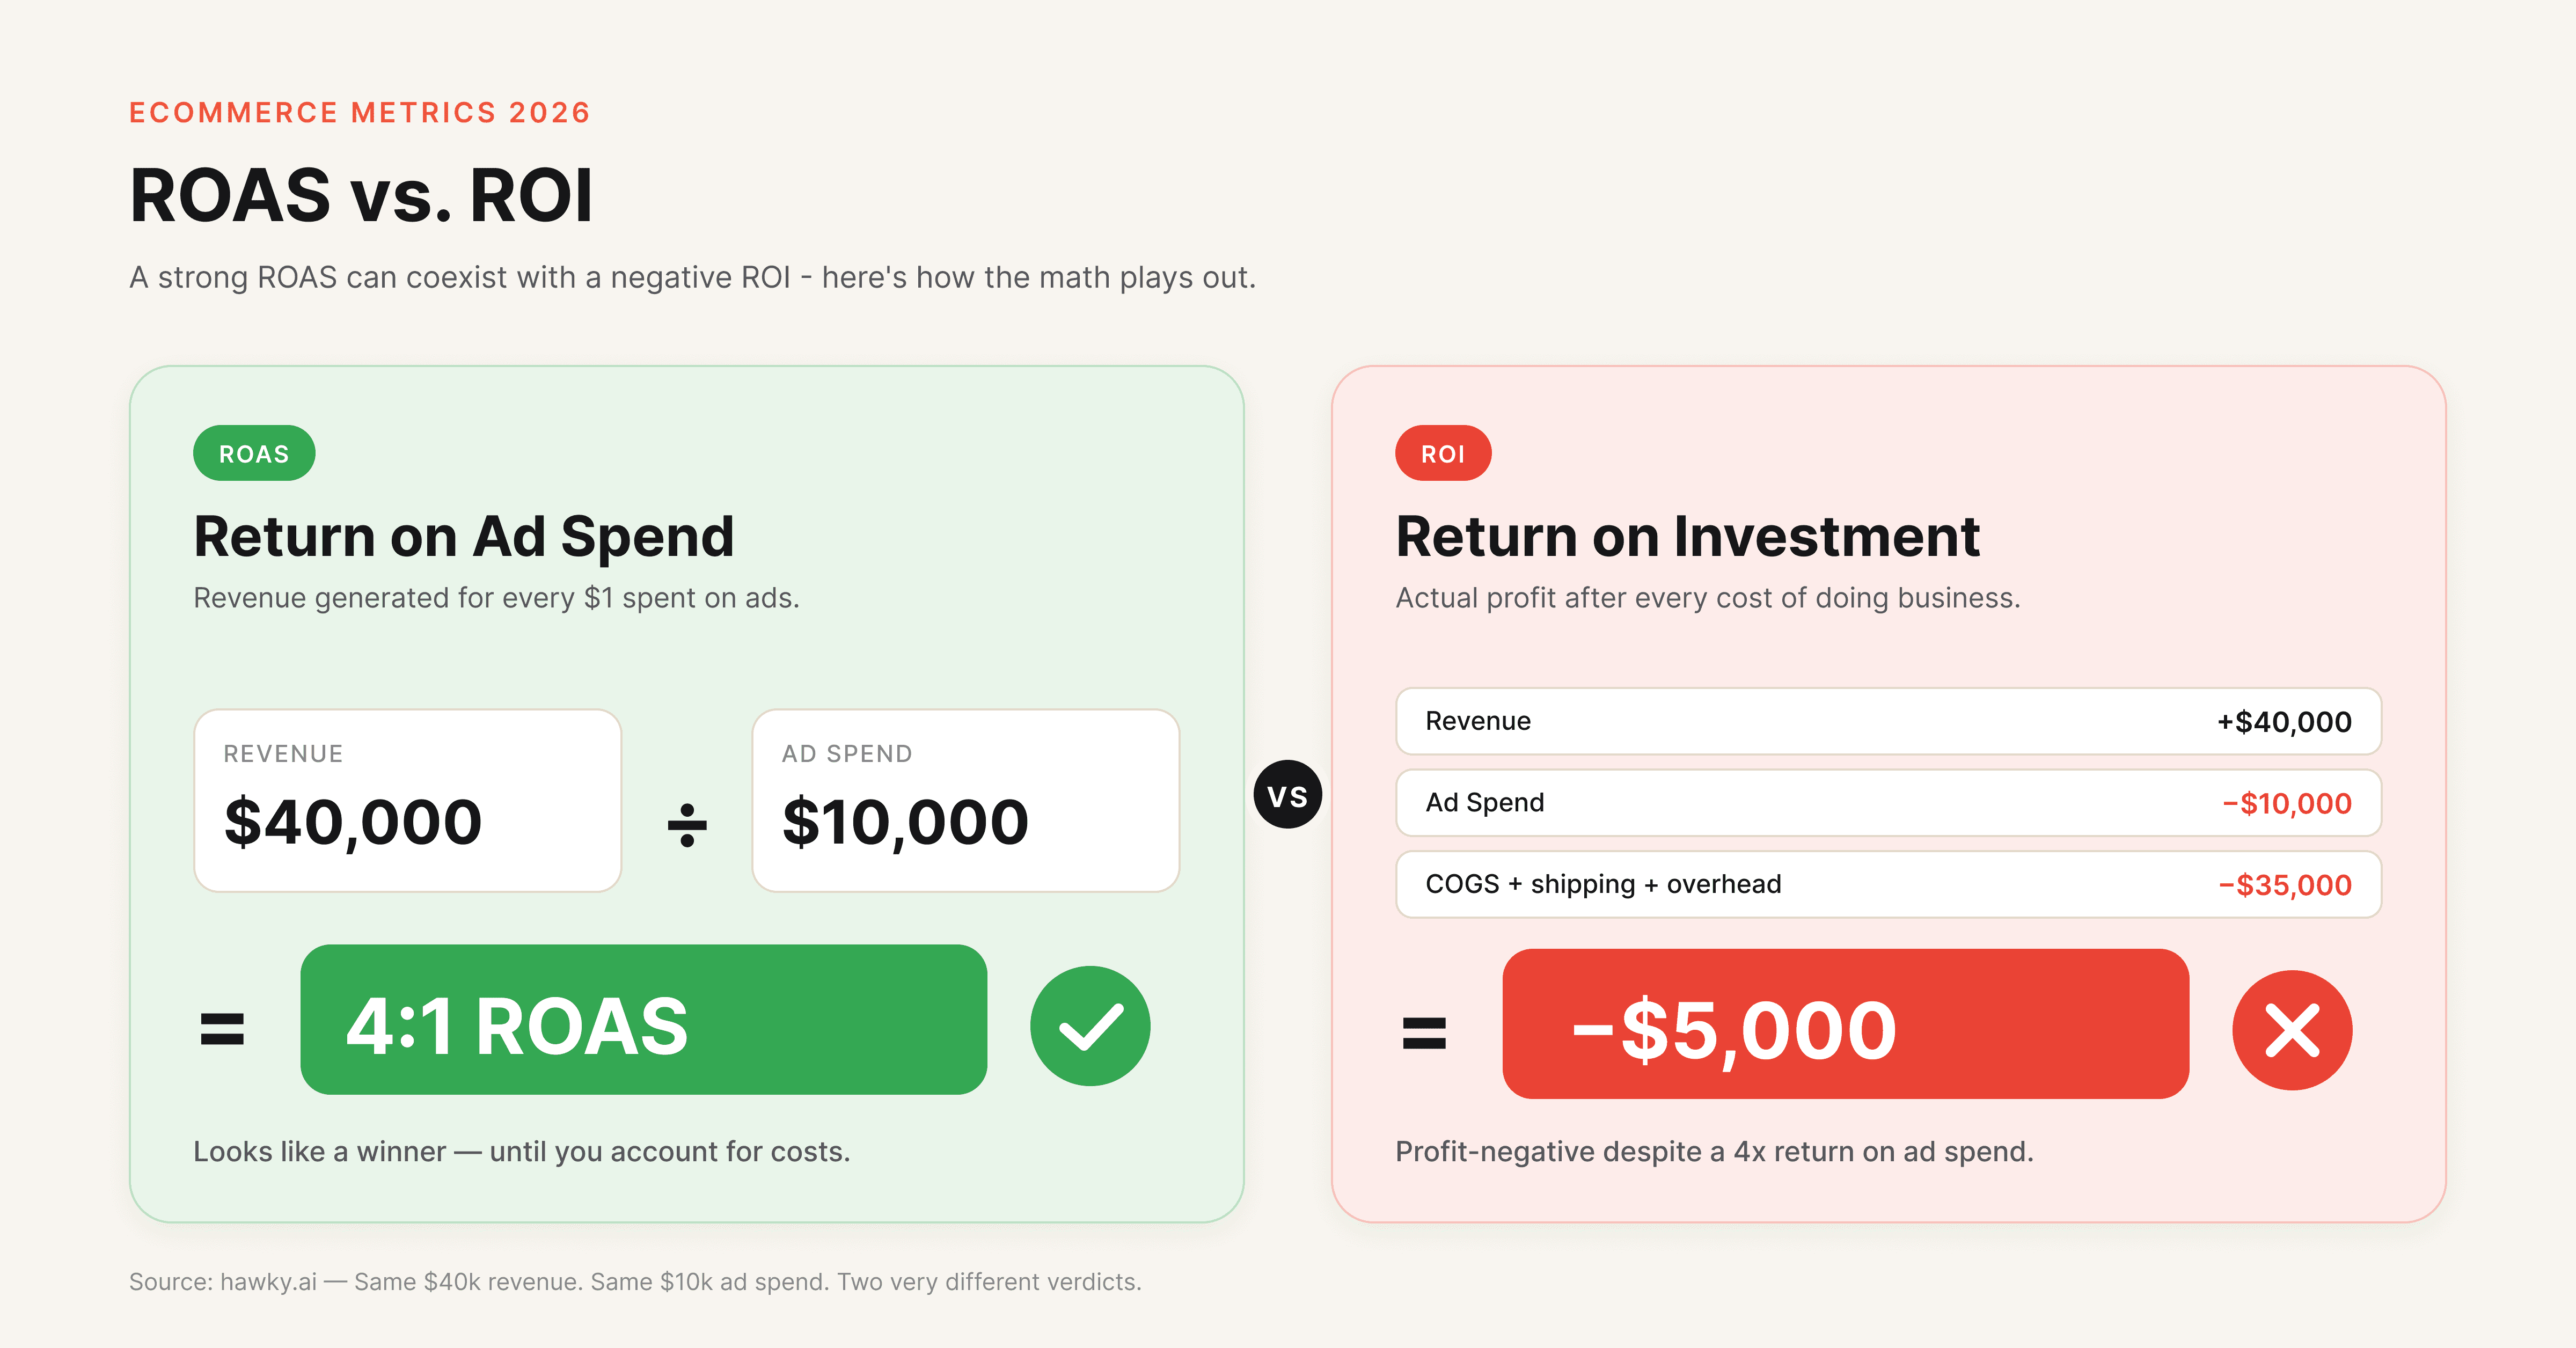
ROAS measures revenue generated per ad dollar. ROI measures total profit after all costs are subtracted. They answer different questions, and confusing them leads to bad budget decisions.
A campaign with a 4:1 ROAS ($40,000 revenue on $10,000 ad spend) might have a negative ROI if product costs, shipping, and operational expenses total $35,000. ROAS tells you the campaign is efficient. ROI tells you the business is profitable.
Performance marketers track ROAS for day-to-day campaign optimization because it provides fast, actionable feedback on what is working. But finance teams and leadership should evaluate campaigns through an ROI lens to understand actual contribution to the bottom line.
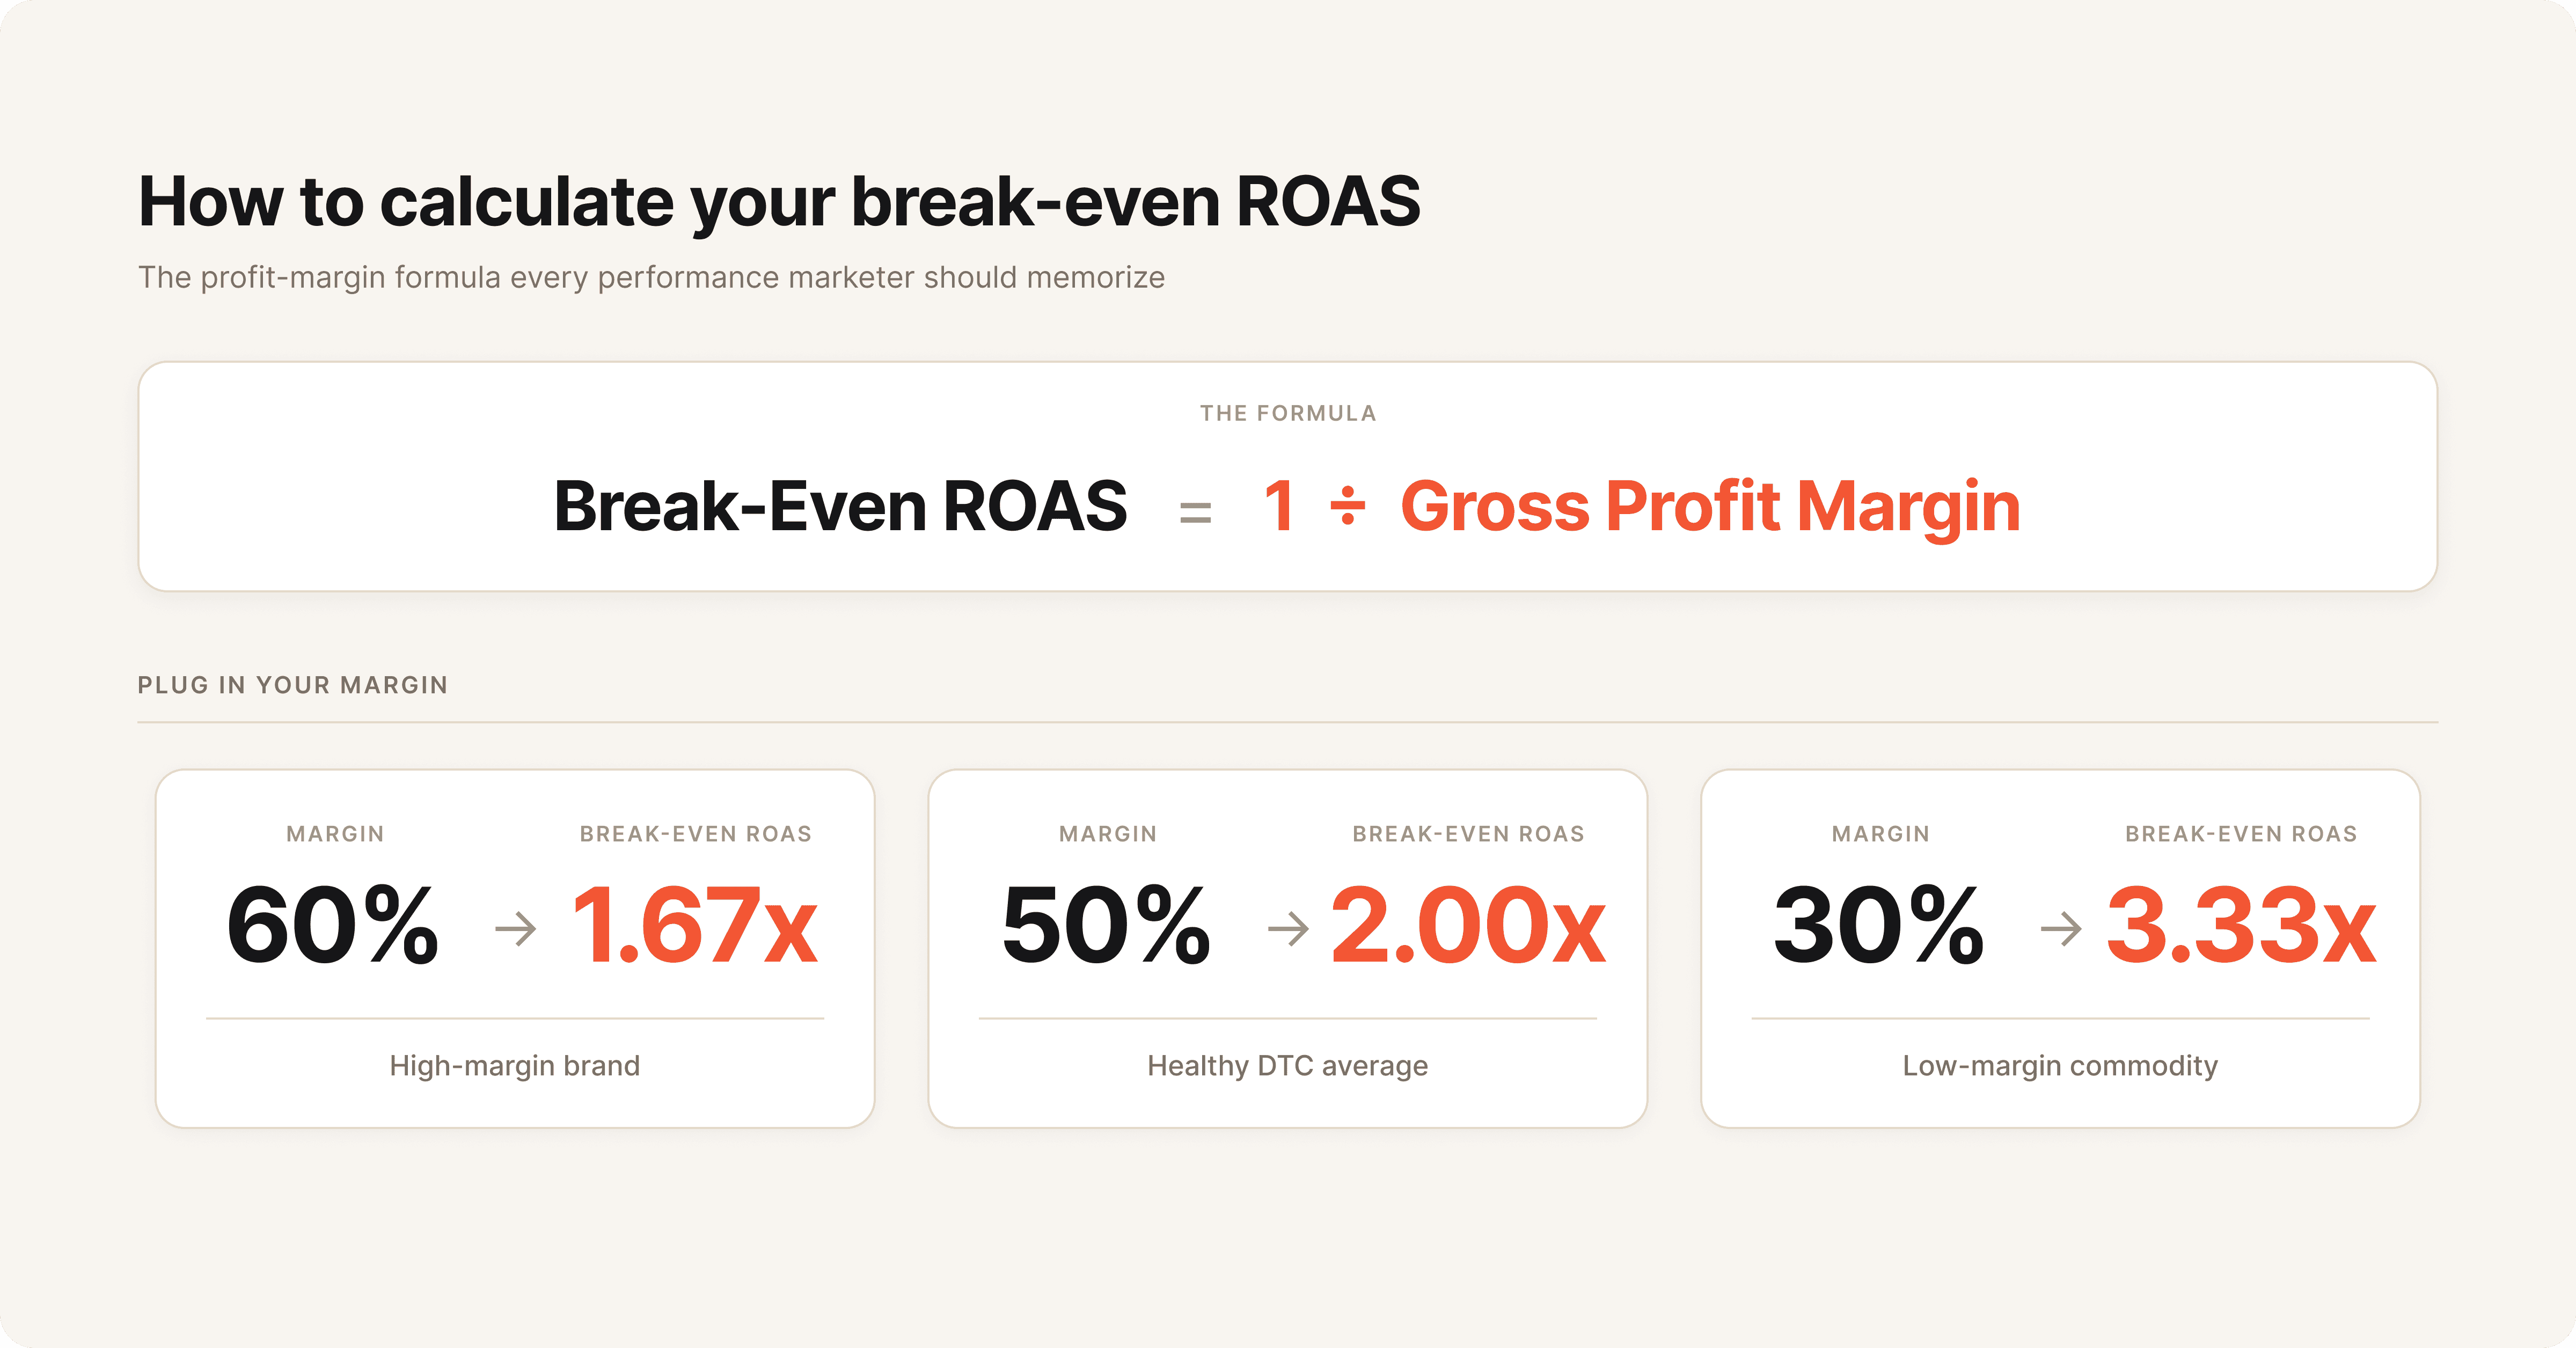
Break-even ROAS is the minimum ROAS required for your ad campaigns to cover costs without losing money. It is the single most important ROAS benchmark for your business because it is specific to your margins, not an industry average.
Break-Even ROAS = 1 / Gross Profit Margin
If your gross profit margin is 50% (after subtracting COGS, shipping, and fulfillment from revenue), your break-even ROAS is:
1 / 0.50 = 2.0
That means you need at least a 2:1 ROAS to cover your ad spend. Anything above 2:1 is profit from paid acquisition. Anything below it, you are losing money on every sale driven by ads.
Gross Profit Margin
Break-Even ROAS
Minimum Target ROAS (with 20% profit buffer)
1.43:1
1.72:1
1.67:1
2.00:1
2.50:1
3.00:1
3.33:1
4.00:1
5.00:1
6.00:1
This calculation explains why the same "average" ROAS of 2.87:1 is great for a high-margin beauty brand and dangerous for a low-margin electronics reseller. Always calculate your break-even first. Then set your target ROAS with a profit buffer (typically 20-30% above break-even).
Platform-reported ROAS and actual ROAS rarely match. Since Apple's iOS 14.5 privacy changes in 2021, Meta, TikTok, and other platforms have lost visibility into a significant portion of conversions. The result: your real ROAS is likely 20-30% higher than what your ad dashboard shows.
Three factors drive the discrepancy:
Attribution windows. Meta's default 7-day click, 1-day view window misses conversions that happen on day 8 or later. For considered purchases (electronics, furniture, high-ticket items), this can exclude 15-25% of conversions that your ads actually influenced.
Cross-device tracking gaps. A customer sees your ad on their phone during lunch, then purchases on their laptop at home. If they are not logged into the same account, the platform cannot connect those events. The ad gets zero credit for a sale it directly caused.
Platform over-counting. On the other side, platforms sometimes take credit for sales that would have happened organically. Retargeting campaigns are especially prone to this. A customer who was already going to buy sees a retargeting ad and clicks it. The platform attributes the sale to the ad, but incrementally, the ad added nothing.
The solution is not to abandon platform metrics. It is to supplement them with blended ROAS (total revenue / total ad spend across all platforms) and incrementality testing to understand the true contribution of each channel.
Blended ROAS divides your total revenue by your total ad spend across all platforms in a given period. It removes the attribution arguments between channels and gives you a single efficiency metric for your entire paid program. Many performance marketers now treat blended ROAS as their north star metric and use platform-specific ROAS only for relative optimization within channels.
Incrementality testing goes a step further. It measures whether your ads are causing sales or just claiming credit for sales that would have happened anyway. Meta's conversion lift studies and Google's geo-based experiments both offer built-in frameworks. The typical finding: 15-30% of platform-reported conversions are non-incremental, meaning the customer would have purchased without seeing the ad.
Improving ROAS comes down to two levers: increasing the revenue each ad dollar generates or reducing the cost of generating that revenue. Here are five approaches that consistently move the needle for eCommerce brands.
Test Creative at the Element Level
Most brands A/B test entire ads against each other. That tells you which ad won, but not why. Breaking creative into elements (hook, body copy, visual, CTA) and testing each independently reveals what is actually driving performance. A strong hook paired with a weak CTA drags down an otherwise effective ad.
Creative intelligence platforms like Hawky automate this process, analyzing performance at the hook, visual, and CTA level to identify which specific components drive conversions. This approach turns creative testing from a guessing game into a systematic process.
Separate Prospecting and Retargeting Budgets
Blending prospecting and retargeting into a single campaign inflates your perceived ROAS. Retargeting converts at 3.6:1 on Meta while prospecting runs at 2.2:1. If you do not separate them, you cannot tell whether your acquisition engine is actually healthy or if warm audiences are masking a prospecting problem.
Optimize Landing Page Experience
Sending high-intent traffic to a generic homepage wastes ad spend. Product-specific landing pages with clear pricing, social proof, and streamlined checkout consistently improve conversion rates by 20-40%, which directly lifts ROAS without changing a single ad.
Monitor Creative Fatigue
Ad performance degrades as audiences see the same creative repeatedly, a phenomenon known as creative fatigue. Most eCommerce brands on Meta start seeing fatigue after 10-14 days of consistent delivery. Track frequency alongside ROAS to identify the inflection point where creative refresh is needed. Proactive fatigue detection (predicting the decline before it shows up in your ROAS) is more effective than waiting for metrics to drop and scrambling to replace creative.
Align Budget to Seasonal ROAS Patterns
Push budget into Q4 when ROAS peaks at 4-5:1 and pull back in Q1 when it drops to 2-2.5:1. This sounds obvious but many brands run flat budgets year-round, overspending in low-return months and underinvesting when efficiency is highest.
Use Lookalike and First-Party Data Audiences
Broad targeting has its place, but the highest-ROAS campaigns typically rely on first-party data: email lists, purchaser data, and site visitor segments. Uploading customer lists to build lookalike audiences on Meta and Google narrows targeting to users with similar purchase patterns, reducing wasted impressions.
As third-party cookies phase out and privacy regulations tighten, first-party data becomes more valuable. Brands that collect and activate their own customer data (email captures, loyalty programs, post-purchase surveys) have a structural advantage in ad efficiency over those relying solely on platform targeting algorithms.
What is the average ROAS for eCommerce in 2026?
The average ROAS for eCommerce in 2026 is 2.87:1, meaning brands generate $2.87 in revenue for every $1 spent on advertising. The median is lower at 2.04:1, indicating that half of all eCommerce businesses return less than $2 per ad dollar.
What is a good ROAS for Facebook ads?
A good Facebook Ads ROAS is typically between 3:1 and 5:1 for eCommerce. The average sits at 2.2:1 for prospecting campaigns and 3.6:1 for retargeting. Brands using Advantage+ Shopping Campaigns report 15-25% higher ROAS than those running manual campaign structures.
How do you calculate ROAS?
ROAS is calculated by dividing the revenue generated from ad campaigns by the total ad spend. The formula is: ROAS = Revenue from Ads / Ad Spend. For example, $40,000 in revenue from $10,000 in ad spend equals a 4:1 ROAS.
Is a 3x ROAS good?
A 3x ROAS is good for brands with gross margins above 40%, as it comfortably exceeds break-even and provides room for profit. For brands with margins below 30%, a 3x ROAS may not cover costs. Calculate your break-even ROAS (1 / gross margin) to determine whether 3x is sufficient for your business.
What is the difference between ROAS and ROI?
ROAS measures revenue per ad dollar spent and only accounts for ad spend. ROI measures total profitability and factors in all business costs including COGS, shipping, overhead, and salaries. A campaign can have a strong ROAS but negative ROI if total costs exceed the revenue generated.
What ROAS do I need to be profitable?
Your profitable ROAS depends on your gross margin. Calculate break-even ROAS with the formula: 1 / Gross Profit Margin. A 50% margin business breaks even at 2:1 ROAS.
Add a 20-30% buffer above break-even for your minimum profitable target. For a 50% margin brand, that means targeting at least 2.4:1 to 2.6:1.
Your ROAS benchmark is only as useful as the data feeding it. If your creative is fatiguing, your attribution is off, or you are comparing blended numbers to platform-specific averages, the benchmark becomes noise. The brands that consistently beat industry averages are the ones that diagnose performance at the creative element level, separate prospecting from retargeting, and set targets based on their own margins rather than someone else's average.
If your team is spending hours pulling creative performance data and still guessing which ad elements are driving results, Hawky's creative intelligence platform is built for that job.