What Is Media Mix Modeling (MMM)? How It Works, Key Benefits & Framework for 2026
Media Mix Modeling (MMM) is a statistical method that measures how each marketing channel contributes to sales or other business outcomes, using historical aggregated data instead of user-level tracking. It uses regression analysis to separate base sales from marketing-driven sales, quantify return on ad spend (ROAS) per channel, and recommend where the next dollar should go.
MMM matters again because the privacy era broke user-level attribution. With cookies deprecated, mobile identifiers restricted, and walled gardens reporting their own self-serving numbers, marketers need a measurement method that does not rely on tracking individuals. MMM is that method, and it has evolved fast in 2026 with Bayesian techniques, open-source tooling from Meta and Google, and AI-augmented data pipelines.
This guide explains what MMM is, how it works, the modern 8-step framework, and how to combine it with creative intelligence so channel decisions translate into creative decisions.
What is media mix modeling?
Media mix modeling is a top-down measurement approach that uses historical, aggregated data to estimate the incremental contribution of each marketing channel to a business KPI. The KPI is usually revenue or units sold, but it can also be leads, app installs, or any conversion event a brand tracks at the aggregate level.
The core idea is simple. Take two to three years of weekly data across spend, sales, price, promotion, seasonality, and external factors. Run a regression model that explains sales as a function of all those inputs. The coefficients on the marketing variables tell you how much each channel contributed to sales, and what the return on ad spend was for every dollar invested.
MMM was invented by Procter & Gamble economists in the 1960s and was a standard practice at large CPG brands for decades. It fell out of favor in the 2010s as digital marketers shifted to user-level attribution because pixels and cookies promised faster, granular insight. The privacy crackdown of the 2020s reversed that.
By 2026, MMM is no longer a CPG-only tool. D2C brands, B2B SaaS companies, and retailers all run some form of MMM, often alongside multi-touch attribution and incrementality tests.
The newer version of MMM looks different from the version P&G ran 50 years ago. It uses Bayesian statistics instead of frequentist regression, runs on open-source code instead of proprietary vendor software, refreshes weekly instead of annually, and increasingly incorporates AI to handle data quality and feature engineering.
Why MMM is essential in 2026
Three forces converged to make MMM essential again.
The first is privacy. Apple's App Tracking Transparency (introduced in iOS 14.5 in April 2021) and the multi-year deprecation of third-party cookies by Chrome eliminated most of the tracking signal that powered last-click and multi-touch attribution. Conversion APIs and clean rooms recovered some signal, but not enough for confident channel-level decisions. For a deeper dive on what Meta changed in this period, see How to Master Meta's New Attribution Model.
The second is platform self-reporting. Meta, Google, TikTok, and Amazon all report their own attributed conversions using their own attribution windows. Adding up self-reported conversions across platforms typically inflates total conversions by 30 to 80 percent versus actual sales. Brands need an independent measurement method that does not rely on what platforms report about themselves.
The third is AI and open source. Meta released Robyn in 2020, Google released Meridian in 2024, and Uber, Lightricks, and a wave of consultancies released their own MMM frameworks. The cost of running an MMM dropped from 250,000 USD per engagement to nearly zero in code, plus internal engineering time.
That made MMM accessible to brands spending 50,000 USD per month, not just brands spending 50 million USD per month. McKinsey's analysis on the resurgence of MMM covers this shift in detail.
The result: MMM is now the foundation of modern measurement stacks. It answers the question "where should I spend my next dollar across channels" with statistical confidence, even in a cookieless world.
How media mix modeling works
MMM works by building a statistical model that decomposes sales into base sales (what would happen without marketing) and incremental sales (what marketing drove). The output tells you how much each channel contributed and what the marginal return was.
Here is the simplified math. Sales at week t is modeled as a function of marketing spend across channels (Meta, Google, TV, OOH, email), plus controls for price, promotions, seasonality, weather, holidays, competitor activity, and any other relevant factor. The model fits coefficients that minimize prediction error on historical data, then those coefficients are used to estimate channel ROI.
Two non-linear transformations make MMM more accurate than a basic regression. Adstock captures the carryover effect: a TV ad seen this week still drives sales next week and the week after. Saturation captures diminishing returns: the second million dollars spent on Meta is worth less than the first million. Without these two transformations, MMM systematically overstates ROI on channels with long carryover and understates the cost of over-investment.
Modern MMMs use Bayesian methods to incorporate prior knowledge. If a brand already knows that paid search has a saturation point around 200,000 USD per month, that prior gets baked into the model. Bayesian MMM also produces credible intervals around every estimate, so marketers see not just "Meta ROAS is 3.2" but "Meta ROAS is 3.2, with 90 percent confidence between 2.7 and 3.6". That uncertainty quantification is one of the biggest practical upgrades over old-school MMM.
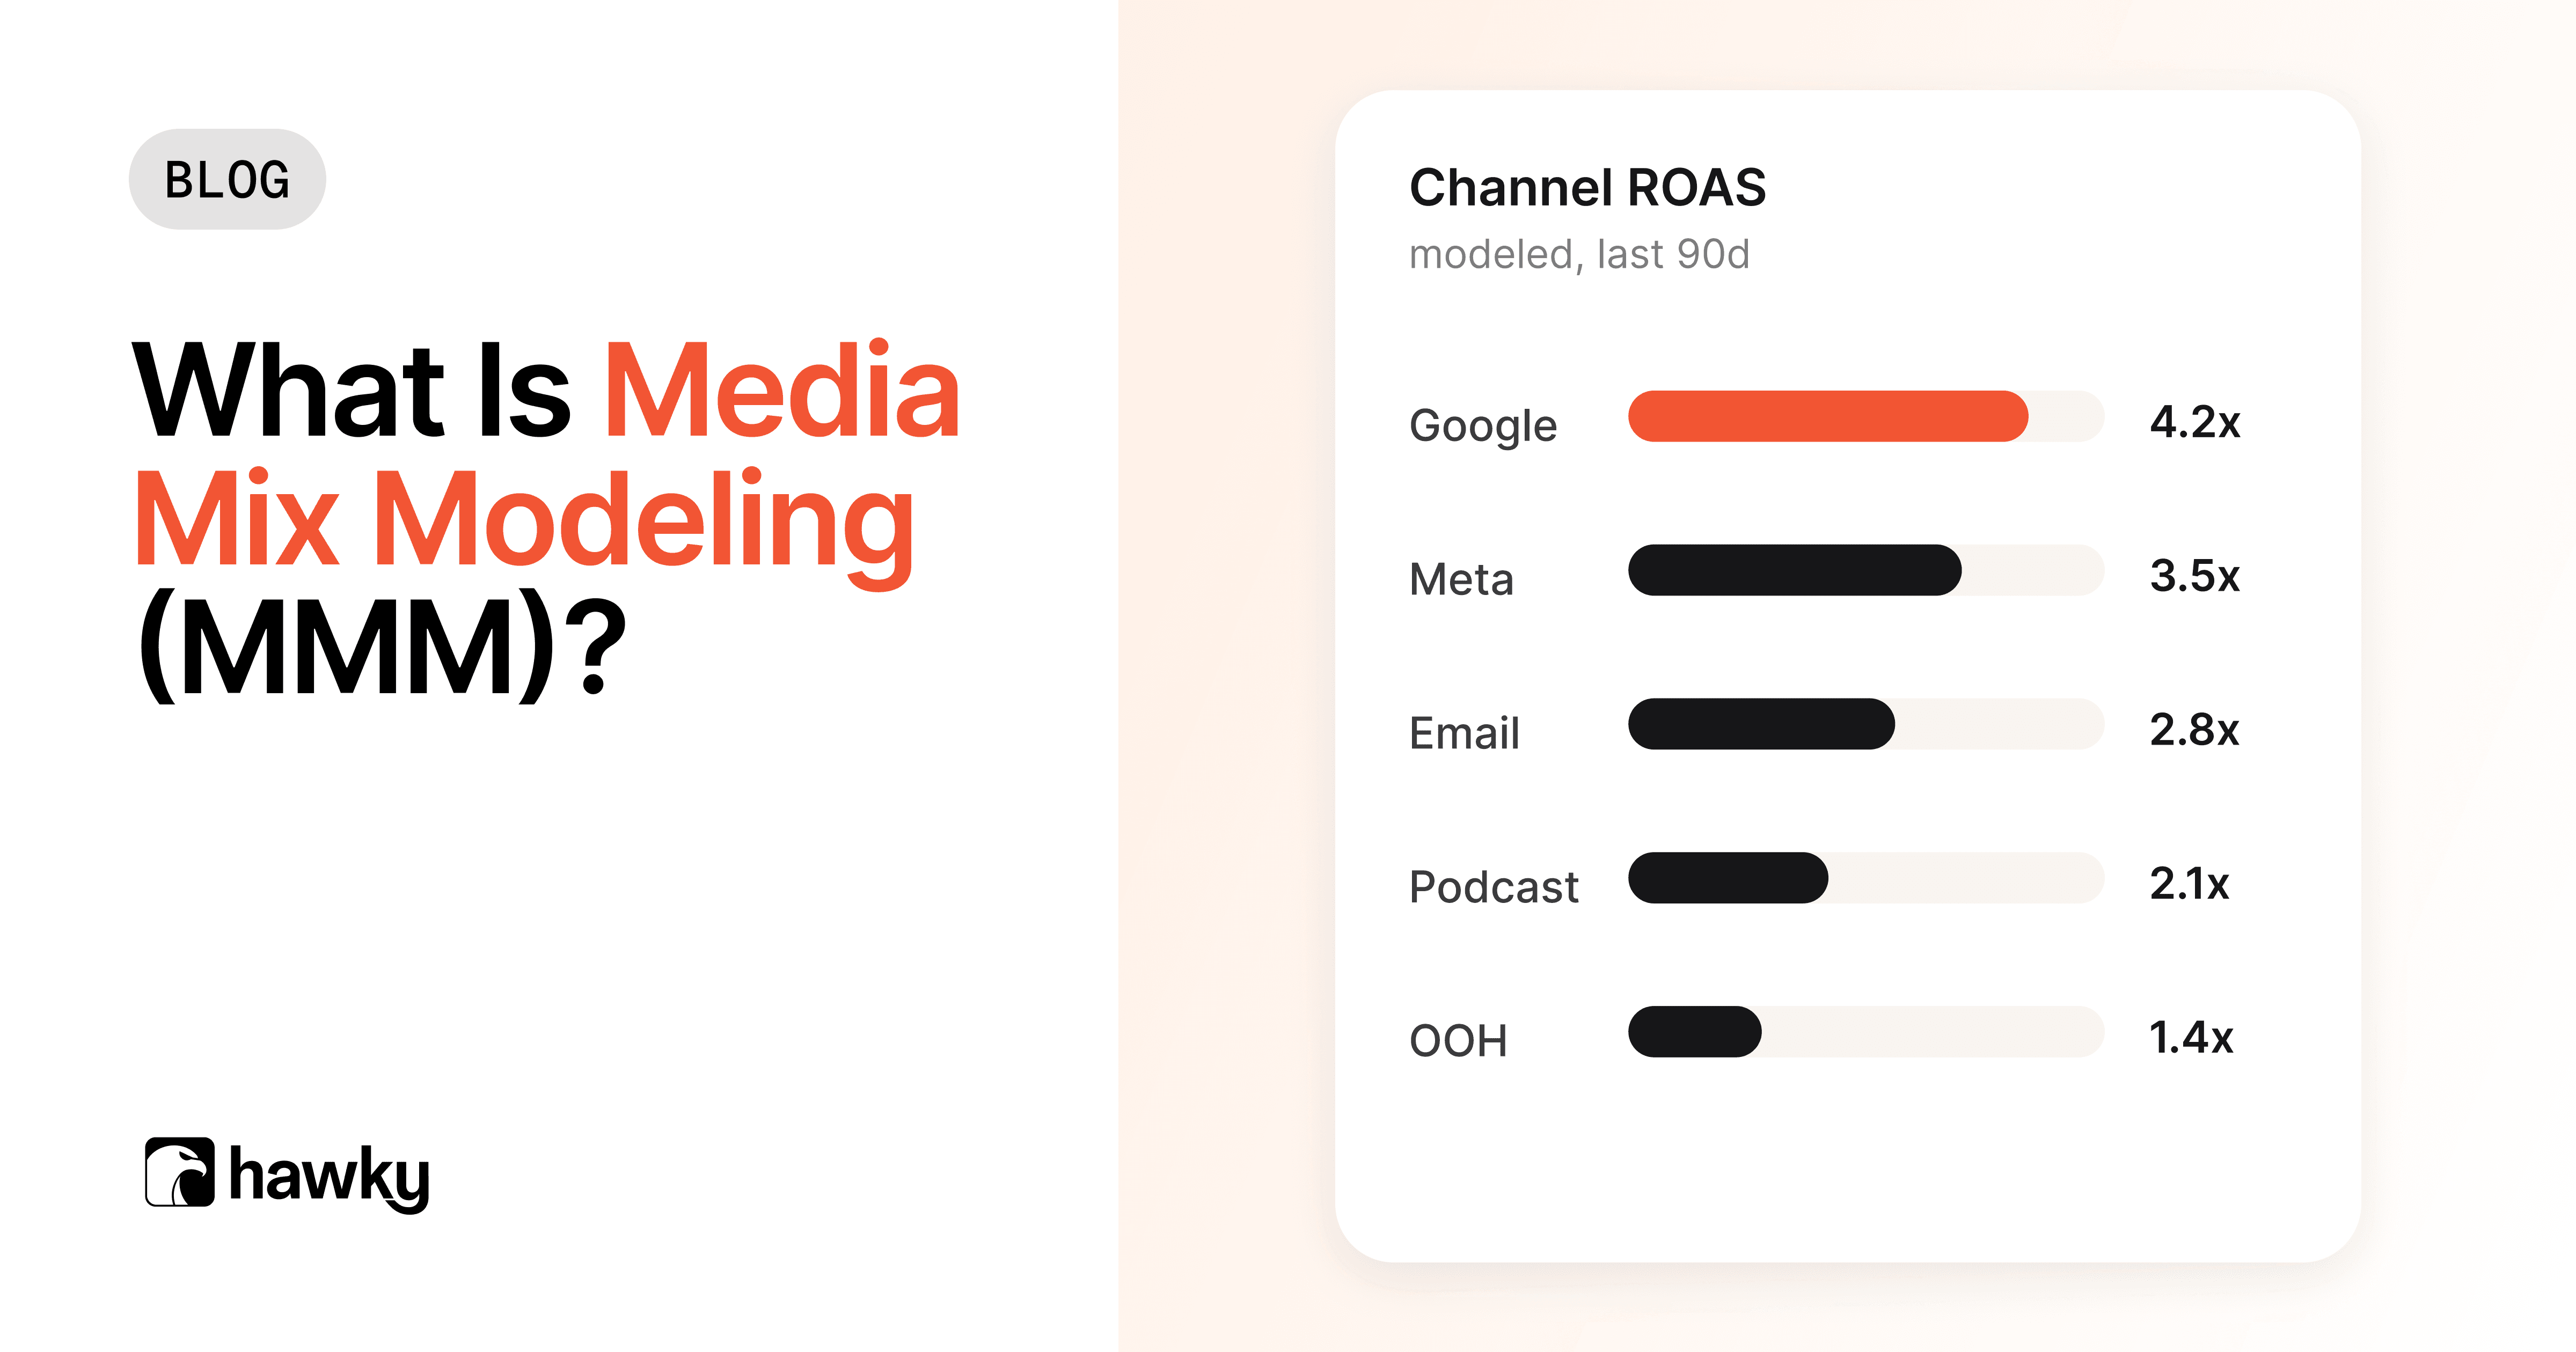
The output is usually a dashboard with three views: contribution decomposition (how much of total sales each channel drove), channel ROAS (return per dollar spent), and a budget optimizer (the recommended spend allocation given a total budget).
Key components of an MMM model

Every MMM has the same building blocks. Understanding each one helps you read MMM outputs critically and avoid being fooled by a slick dashboard.
| Component | What it measures | Why it matters |
|---|---|---|
| Base sales | Sales the brand would generate without any marketing | Sets the baseline. If base sales are 70% of total, marketing is doing 30% of the work |
| Incremental sales | Sales caused by each marketing channel | The number that drives budget decisions |
| Adstock | Lagged effect of past marketing on current sales | Without adstock, TV and OOH look weaker than they are |
| Saturation curves | Diminishing returns as spend increases | Without saturation, the model recommends infinite spend |
| Halo effects | One channel lifting another (e.g., TV lifting branded search) | Captures the real interaction between channels |
| Control variables | Price, promotion, seasonality, weather, competitor activity | Without controls, the model attributes everything to marketing |
| External factors | Macroeconomic shifts, holidays, supply shocks | Crucial for any model run during 2020 to 2024 |
| Calibration | Validation against incrementality tests or geo experiments | Bayesian priors that anchor the model in reality |
The biggest mistake in MMM is treating the output as ground truth. An MMM is only as good as its data, its specification, and its calibration. Two skilled analysts can build two different MMMs on the same data and reach different conclusions. That is why calibration with geo lift tests is now considered table stakes in modern MMM.
MMM vs. multi-touch attribution (MTA)
The fastest way to understand MMM is to compare it with multi-touch attribution (MTA), which is the other major measurement approach.
| Dimension | Media Mix Modeling (MMM) | Multi-Touch Attribution (MTA) |
|---|---|---|
| Data type | Aggregated, weekly or daily | User-level, per impression and click |
| Tracking required | None at user level | Pixels, SDKs, identifiers |
| Privacy impact | Privacy-safe, works without cookies | Heavily impacted by ATT, cookie loss, walled gardens |
| Channels covered | All channels including offline | Mostly digital channels with tracking |
| Refresh cadence | Weekly to quarterly | Real-time or daily |
| Cost | Low (open source) to high (vendor) | Medium (platform pixels) to high (vendor MTA) |
| Best for | Strategic budget allocation across channels | Tactical optimization within digital channels |
| Weakness | Cannot answer "which keyword converted user X" | Cannot measure offline channels or capture true incrementality |
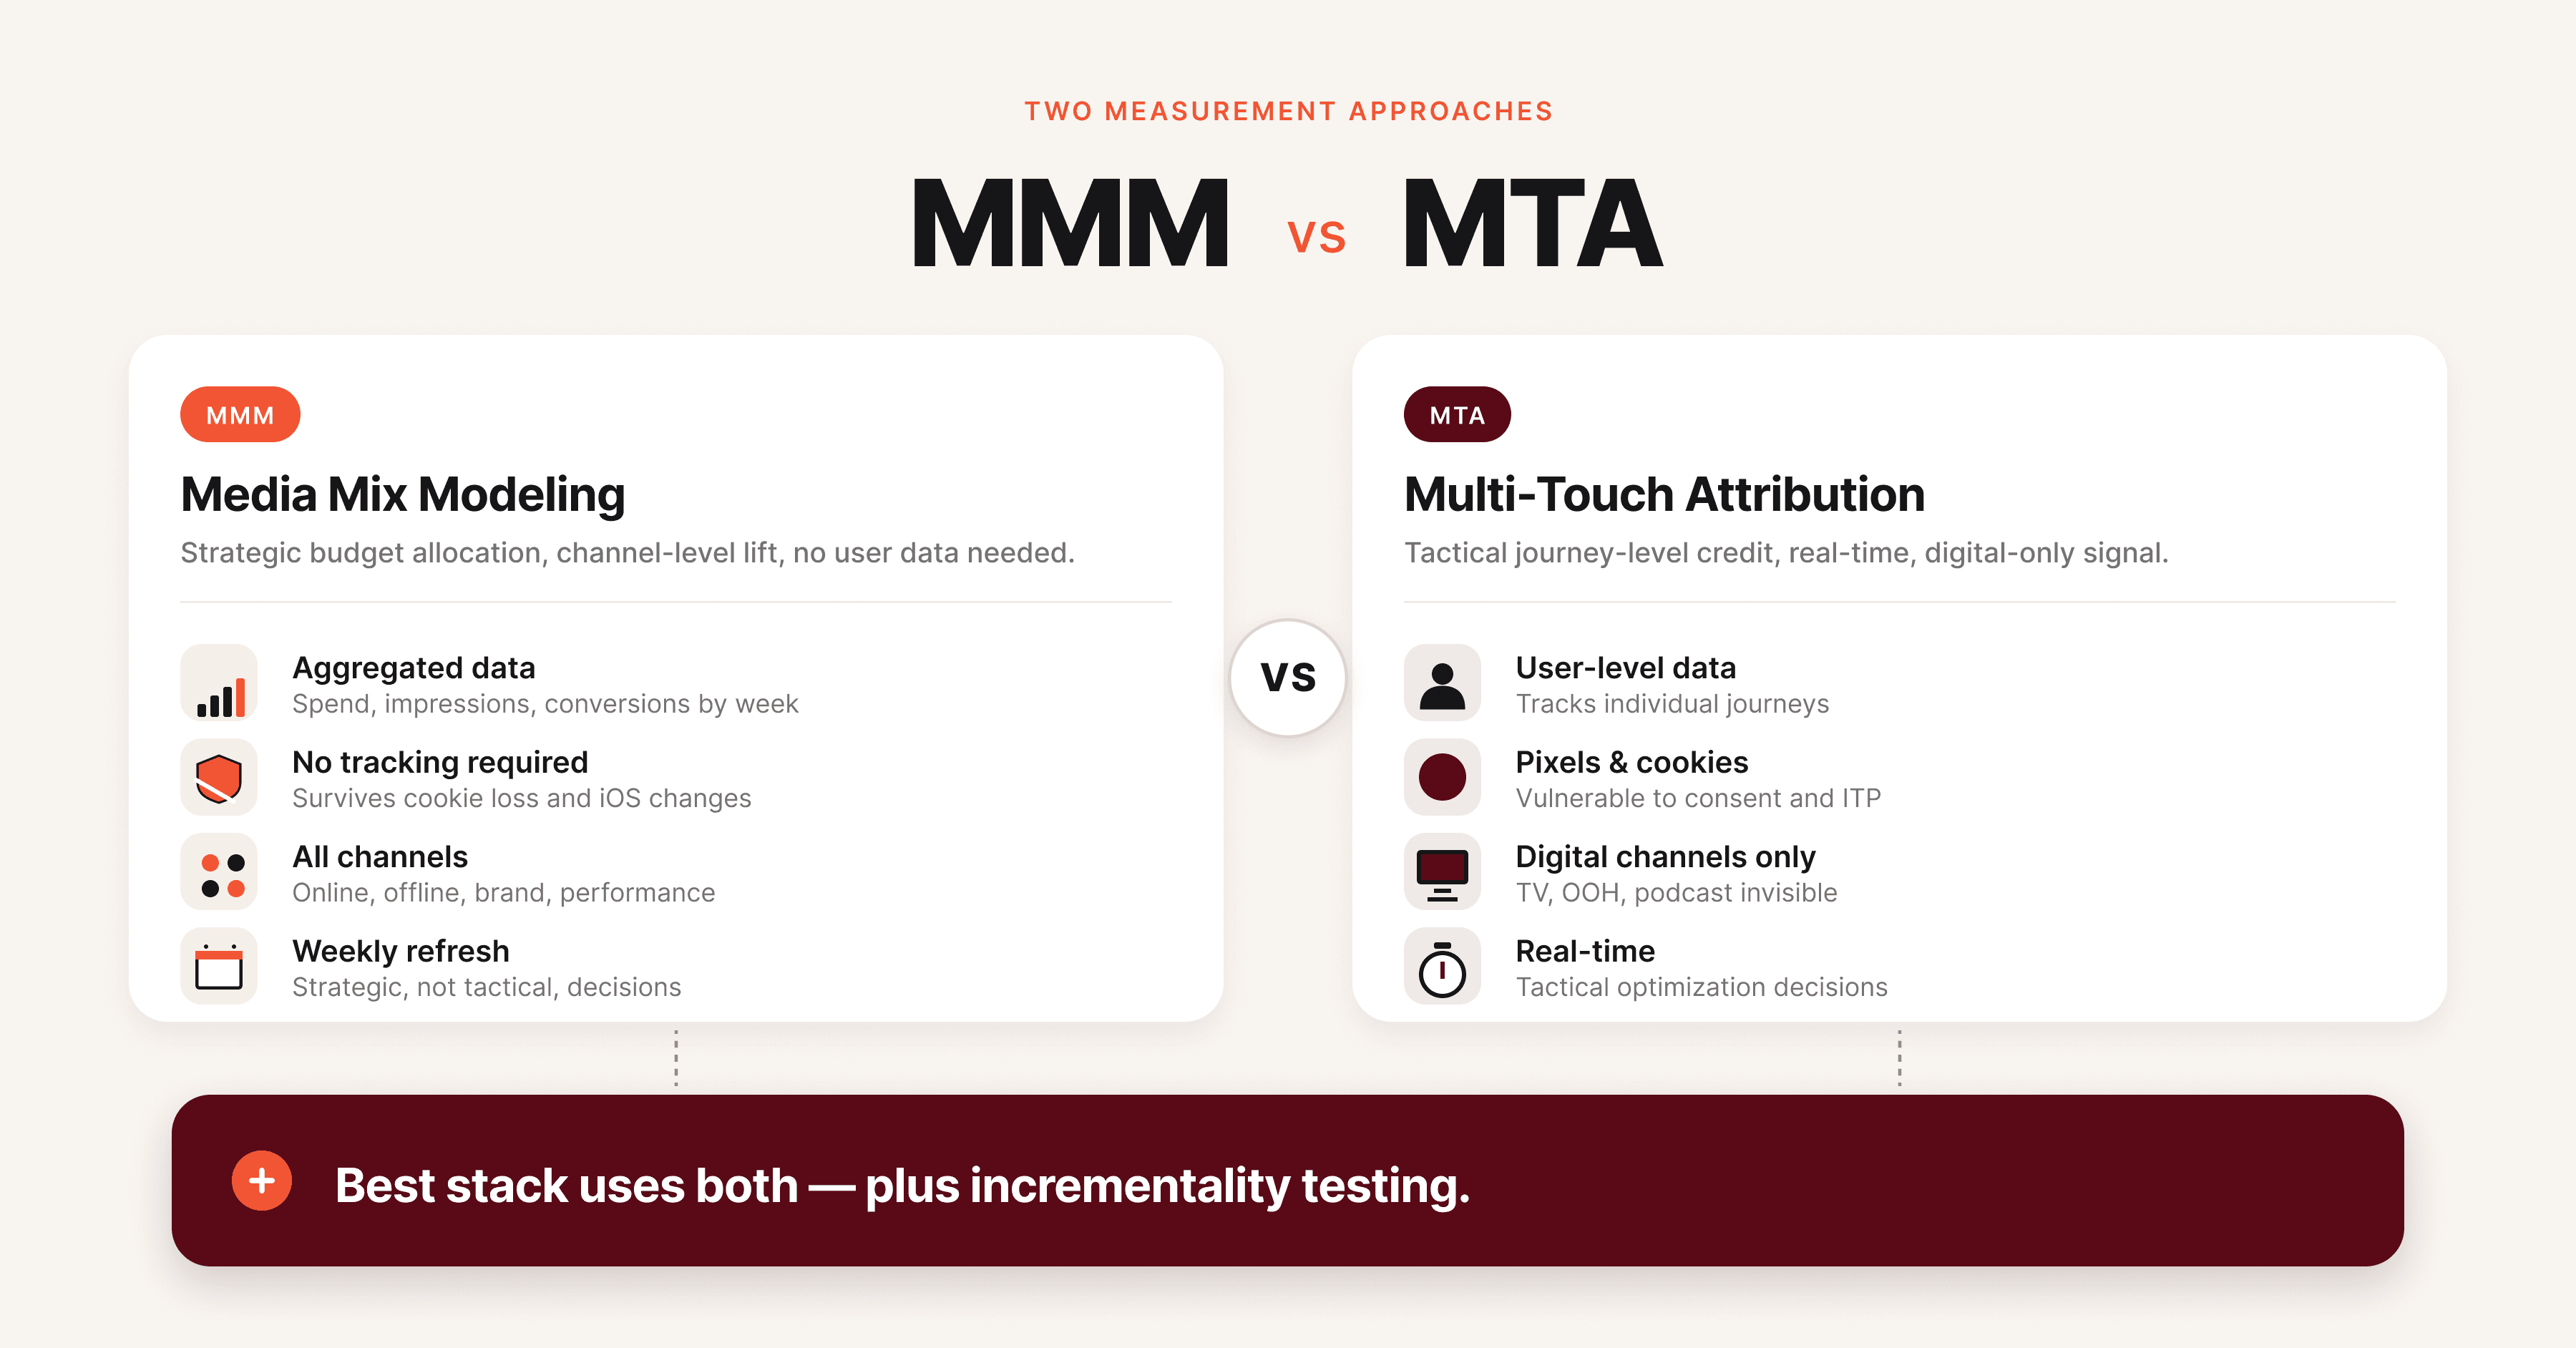
MMM and MTA are not rivals. They answer different questions. MMM tells you whether to put 1 million USD into TV or Meta. MTA tells you which Google Ads keyword to bid up.
The modern measurement stack uses MMM for top-down strategic decisions, MTA for tactical in-channel optimization, and incrementality tests to calibrate both.
Incrementality testing
Incrementality testing is the third pillar of modern measurement and the truth-teller of the three.
An incrementality test holds back a channel from a randomly selected geographic region or audience cohort, then compares outcomes with a control group that received the channel as normal. The difference is the true causal effect of that channel. Geo lift tests, conversion lift studies, and randomized holdout experiments all fall under incrementality testing.
MMM and incrementality work together. MMM gives a continuous, broad view across all channels but its estimates are correlational. Incrementality tests give a clean causal estimate for one channel at one point in time but are expensive and slow to run for every channel.
The standard 2026 practice is to run a small portfolio of incrementality tests every quarter and use them as Bayesian priors that calibrate the MMM. The model learns from the experiments, the experiments validate the model.
Five ways MMM creates value
MMM delivers value in five concrete ways for performance marketers and CMOs.
Privacy-safe measurement. MMM uses aggregated data only, so it works regardless of cookie loss, ATT prompts, or walled garden restrictions. As more privacy regulations take effect (DMA in Europe, state privacy laws in the United States, India's DPDP Act), MMM becomes the default measurement layer.
Cross-channel comparison. MMM puts Meta, Google, TV, OOH, podcasts, and email on the same scoreboard. Marketers can finally compare a TV dollar against a Meta dollar against a podcast dollar, which is impossible with platform-reported attribution.
Budget optimization. Once the model fits, the budget optimizer recommends a reallocation that maximizes total sales given the budget. Most MMMs find 10 to 25 percent improvement opportunities by reallocating from saturated channels to underfunded ones.
Saturation insight. MMM tells you when a channel is running out of room. If Meta saturates at 600,000 USD per month and the brand is spending 800,000 USD per month, the marginal 200,000 USD is lighting money on fire. That insight alone often pays for the model.
Strategic planning. MMM outputs feed annual planning, M&A diligence, and investor narratives. CFOs trust MMM more than attribution because it ties to actual sales, not platform-reported conversions.
The catch: MMM tells you where to spend at the channel level, not what creative to run. A channel-level MMM that says "spend more on Meta" still leaves the question of which Meta creative, which audience, which placement. That gap is where creative intelligence platforms like Hawky's element-level Creative Analysis come in. MMM sets the channel budget, creative intelligence picks the winning creative inside that budget.
The 8-step MMM framework
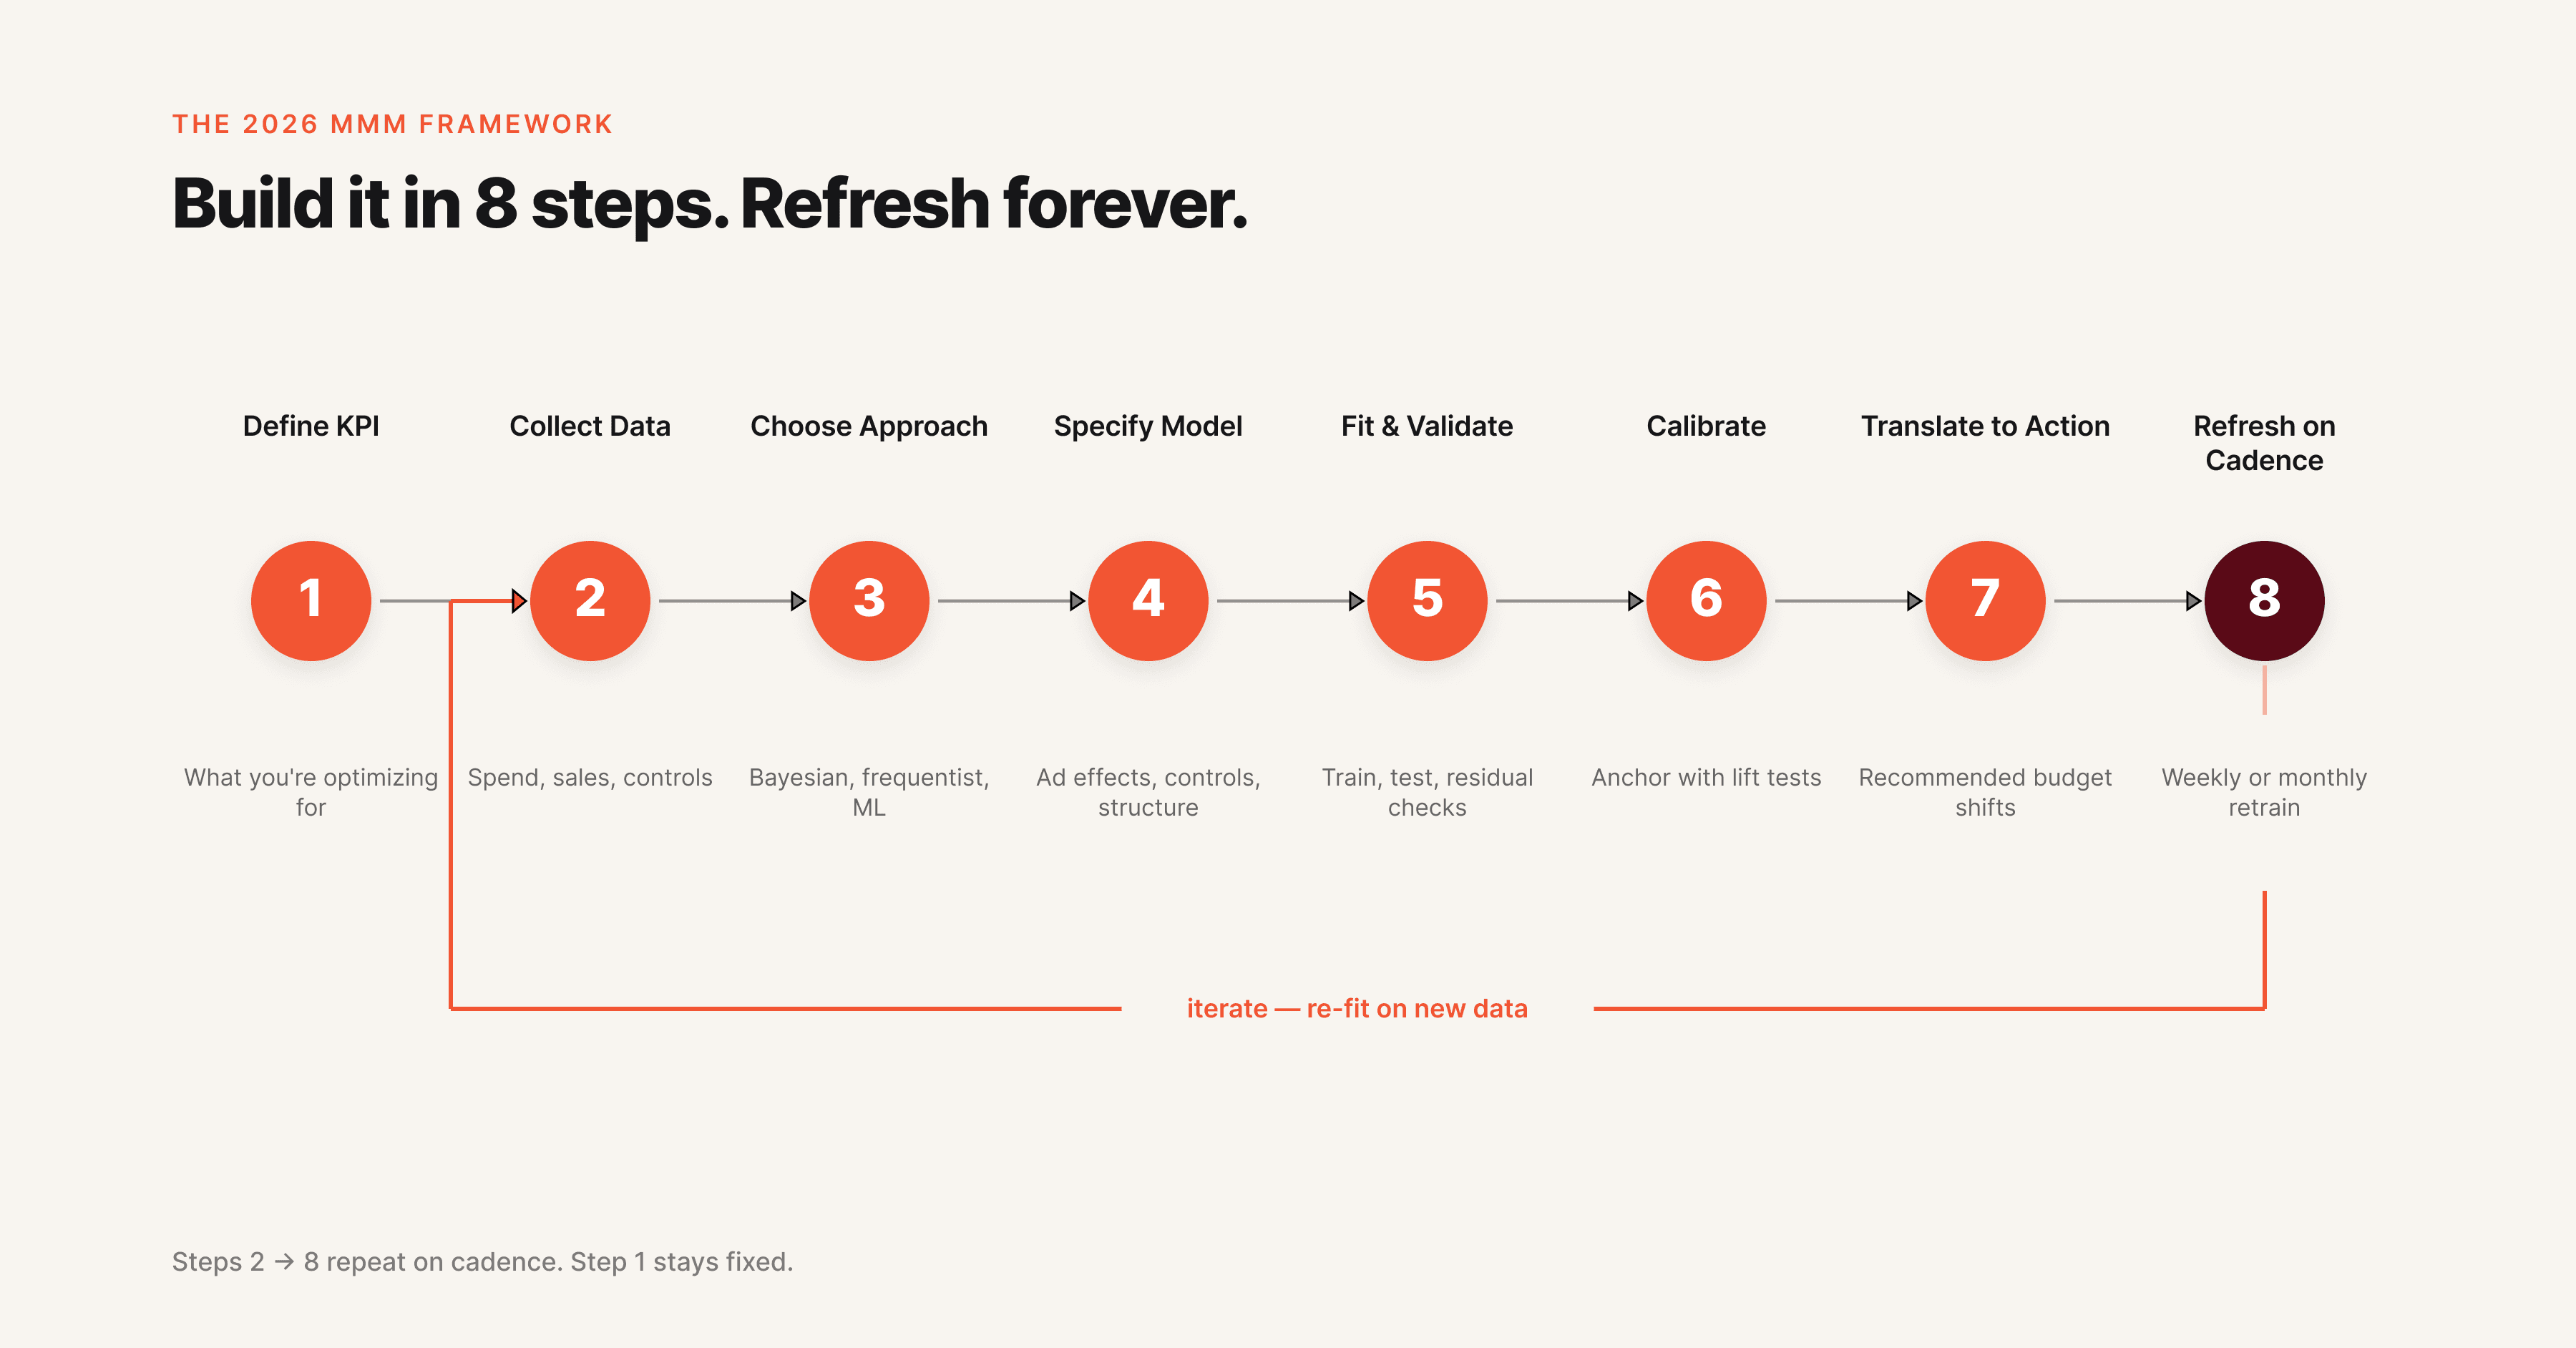
A practical 8-step framework for building an MMM in 2026, suitable for in-house teams or hybrid setups with a vendor.
Step 1: Define the business question and KPI. Pick one primary KPI (revenue, gross profit, or net new customers). Pick a model horizon (weekly is standard, daily is possible with enough data). Confirm what decision the model needs to inform.
Step 2: Collect and unify data. Gather two to three years of weekly data across spend, impressions, sales, price, promotion, seasonality, weather, competitor activity, and external factors. Data quality is the single biggest predictor of model quality. Plan to spend 40 to 60 percent of project time here.
Step 3: Choose your modeling approach. Pick a Bayesian framework (Robyn, Meridian, or PyMC-Marketing) over a frequentist regression. Bayesian methods produce credible intervals, support priors from incrementality tests, and handle small datasets better.
Step 4: Specify the model. Decide on adstock function (geometric or Weibull), saturation curve (Hill or logistic), control variables, and prior distributions. Document every choice. The biggest source of variance between two MMMs is specification, not data.
Step 5: Fit and validate. Train the model on 70 to 80 percent of the data, hold out the rest for validation. Check residuals, parameter stability, and prediction error on the holdout. A good model has stable coefficients across rolling windows and predicts holdout sales within 10 percent error.
Step 6: Calibrate with experiments. Run at least one geo lift test or conversion lift test per channel per year. Use the experimental result as a Bayesian prior on the channel's coefficient. Without calibration, an MMM is a guess with credibility intervals.
Step 7: Translate to action. Convert model outputs into a budget recommendation, a saturation map, and a creative brief. The handoff from analyst to marketer is where most MMMs die. Build executive-ready outputs in the same week the model finishes.
Step 8: Refresh on a cadence. Weekly is ideal, monthly is acceptable, quarterly is the slowest defensible cadence in 2026. Each refresh should incorporate the latest week of data and any new experiments.
Real-world MMM example
A D2C apparel brand spending 500,000 USD per month across Meta, Google, TikTok, OOH, and influencer partnerships uses MMM to answer one question: where should the next 100,000 USD go.
The model finds that Meta drives 38 percent of marketing-attributed sales but is starting to saturate around 220,000 USD per month. Google drives 27 percent and has room to grow up to 180,000 USD per month before saturation. TikTok drives 18 percent and is in the steep part of its growth curve.
OOH drives 10 percent with strong halo effects on branded search. Influencer drives 7 percent with the highest variance.
The optimizer recommends shifting 30,000 USD from Meta (already saturated) to TikTok (still growing) and 20,000 USD from influencer (high variance) to Google (room to grow). The forecasted result: 14 percent more sales from the same total spend.
But the MMM stops at the channel level. The brand still needs to know which Meta creative to scale, which Google search themes to push, which TikTok hooks are working. That is the bottom-up creative layer.
Brands using Hawky's Creative Analysis get element-level performance scoring on hooks, visuals, CTAs, and body copy. MMM tells the brand to spend 220,000 USD on Meta. Creative intelligence tells the brand which 12 ads inside that 220,000 USD to scale and which 30 to pause.
Both layers are needed. For a deeper read on this approach, see Creative Performance Analysis: How to Find Your Winning Creative.
The brand refreshes its MMM monthly, runs one incrementality test per quarter, and uses Hawky's Command Center to translate creative-level insight into pause and budget actions inside Meta and Google.
How to get started with MMM
Three paths exist depending on team size and maturity.
The DIY path uses open-source tools. Meta Robyn and Google Meridian are both free, well-documented, and battle-tested. A small data science team (one analyst, one engineer) can deliver a working model in 8 to 12 weeks. Best for brands with internal data science capability and a culture of measurement.
The hybrid path uses a consultancy or vendor for the first build, then transfers ownership in-house. Several boutique consultancies offer first-build engagements at 30,000 to 80,000 USD with a 6 to 12 week timeline, after which the brand maintains the model itself. Best for brands that want speed without long-term vendor lock-in.
The full vendor path uses platforms like Analytic Partners, Mass Analytics, Nielsen, or Recast. Costs run 100,000 to 500,000 USD per year, with quarterly or monthly refresh, full data engineering handled, and ongoing analyst support. Best for enterprise brands spending more than 5 million USD per month on marketing where the cost is small relative to spend.
For a deeper grounding in the metrics that feed any measurement framework, see Mastering Performance Marketing: Key Metrics and Tools. For a tool-by-tool comparison of analytics platforms used alongside MMM, see 9 Best Ad Creative Analysis Tools in 2026.
Common MMM pitfalls
Even a well-built MMM can mislead if these issues are not addressed.
Garbage data, garbage model. Two years of clean weekly spend, impressions, and sales data is the minimum. Most data quality issues come from inconsistent UTM tagging, mismatched currencies across markets, and offline channels reported in different formats than digital.
Multicollinearity. When channels move together (because the brand always increases all spend during big sales periods), the model cannot tell them apart. Solution: introduce variation deliberately through staggered geo tests or budget shifts.
Over-fitting. A model that fits historical data perfectly often predicts future data poorly. Bayesian priors and holdout validation prevent this.
Ignoring creative quality. Two Meta dollars are not equal. A dollar on a high-performing creative drives 3x the sales of a dollar on an average creative. Channel-level MMM ignores this entirely. Pair it with creative intelligence to close the loop.
Slow refresh. A quarterly model is stale 11 weeks out of every 13. Move to weekly or monthly refresh in 2026 with automated data pipelines.
No calibration. An uncalibrated MMM is a hypothesis. An MMM calibrated against geo lift tests is closer to a measurement. Run experiments.
Frequently asked questions
What is media mix modeling in simple terms? Media mix modeling is a statistical technique that uses historical sales and marketing data to figure out how much each marketing channel contributes to sales. It produces a return on ad spend (ROAS) estimate per channel and recommends how to reallocate budget for higher total sales.
What is the difference between MMM and attribution? MMM uses aggregated data and statistical regression to estimate channel-level contribution to sales. Attribution uses user-level tracking (pixels, cookies, IDs) to credit specific touchpoints with specific conversions. MMM works without user tracking; attribution does not.
How long does it take to build an MMM? A first build typically takes 8 to 12 weeks with open-source tools and an in-house team, 6 to 12 weeks with a consultancy, and 12 to 24 weeks with an enterprise vendor. Data preparation accounts for 40 to 60 percent of the timeline.
What data do you need for media mix modeling? At minimum: 2 to 3 years of weekly data covering marketing spend by channel, impressions, sales or your primary KPI, price, promotion, seasonality, and external factors like holidays and weather. Three years and weekly granularity is the standard.
How accurate is media mix modeling? A well-built MMM typically predicts holdout sales within 5 to 10 percent error. Channel-level ROAS estimates have credible intervals of plus or minus 20 to 40 percent depending on data quality and channel volatility. Calibration with incrementality tests tightens these intervals.
What is Bayesian MMM? Bayesian MMM uses Bayesian statistics instead of frequentist regression. It incorporates prior knowledge (from past models or experiments), produces credible intervals around every estimate, and handles small datasets better. Robyn, Meridian, and PyMC-Marketing are all Bayesian.
Is MMM better than MTA? Neither is universally better. MMM is better for cross-channel strategic decisions and offline channel measurement. MTA is better for in-channel tactical optimization in digital. The strongest measurement stacks use both, plus incrementality testing.
The bottom line
Media mix modeling is the privacy-safe, cross-channel measurement method that the modern marketing stack is built on. It tells you where to spend at the channel level with statistical confidence, even when cookies and identifiers are gone.
But MMM is incomplete on its own. It tells you to spend 200,000 USD on Meta. It does not tell you which Meta creative to scale, which hook is fatigued, or which competitor just changed their messaging. That is the creative intelligence layer.
If channel-level allocation is your problem, MMM is built for that job. If creative-level decisions inside that allocation are your problem, Hawky's Creative Analysis, Competitor Analysis, and Command Center are built for that job. The complete measurement stack uses both.