CPR in Meta Ads: What It Means and How to Lower It

CPR (Cost Per Result) is the average amount your Meta ad campaign spends to achieve one desired action, whether that's a purchase, a lead, a click, or a video view. It's the single metric that tells you whether your ad spend is translating into outcomes or just burning budget.
Most performance marketers check CPR daily. Fewer know how to systematically bring it down. This guide breaks down what CPR actually measures, how to calculate it, what "good" looks like for your industry, and a step-by-step process for lowering it across your Meta campaigns.
Cost Per Result (CPR) is Meta's primary efficiency metric for ad campaigns. It measures the average cost of achieving the specific outcome your campaign is optimized for. That outcome, or "result," changes based on your campaign objective.
If you're running a conversions campaign optimized for purchases, your CPR tells you the average cost per purchase. If you're running a lead generation campaign, CPR is your cost per lead. For traffic campaigns, it's cost per link click.
CPR is not a fixed metric. It fluctuates based on audience competition, creative quality, relevance scores, time of year, and how well Meta's algorithm can find convertible users within your target audience. Understanding what drives those fluctuations is the first step toward controlling them.
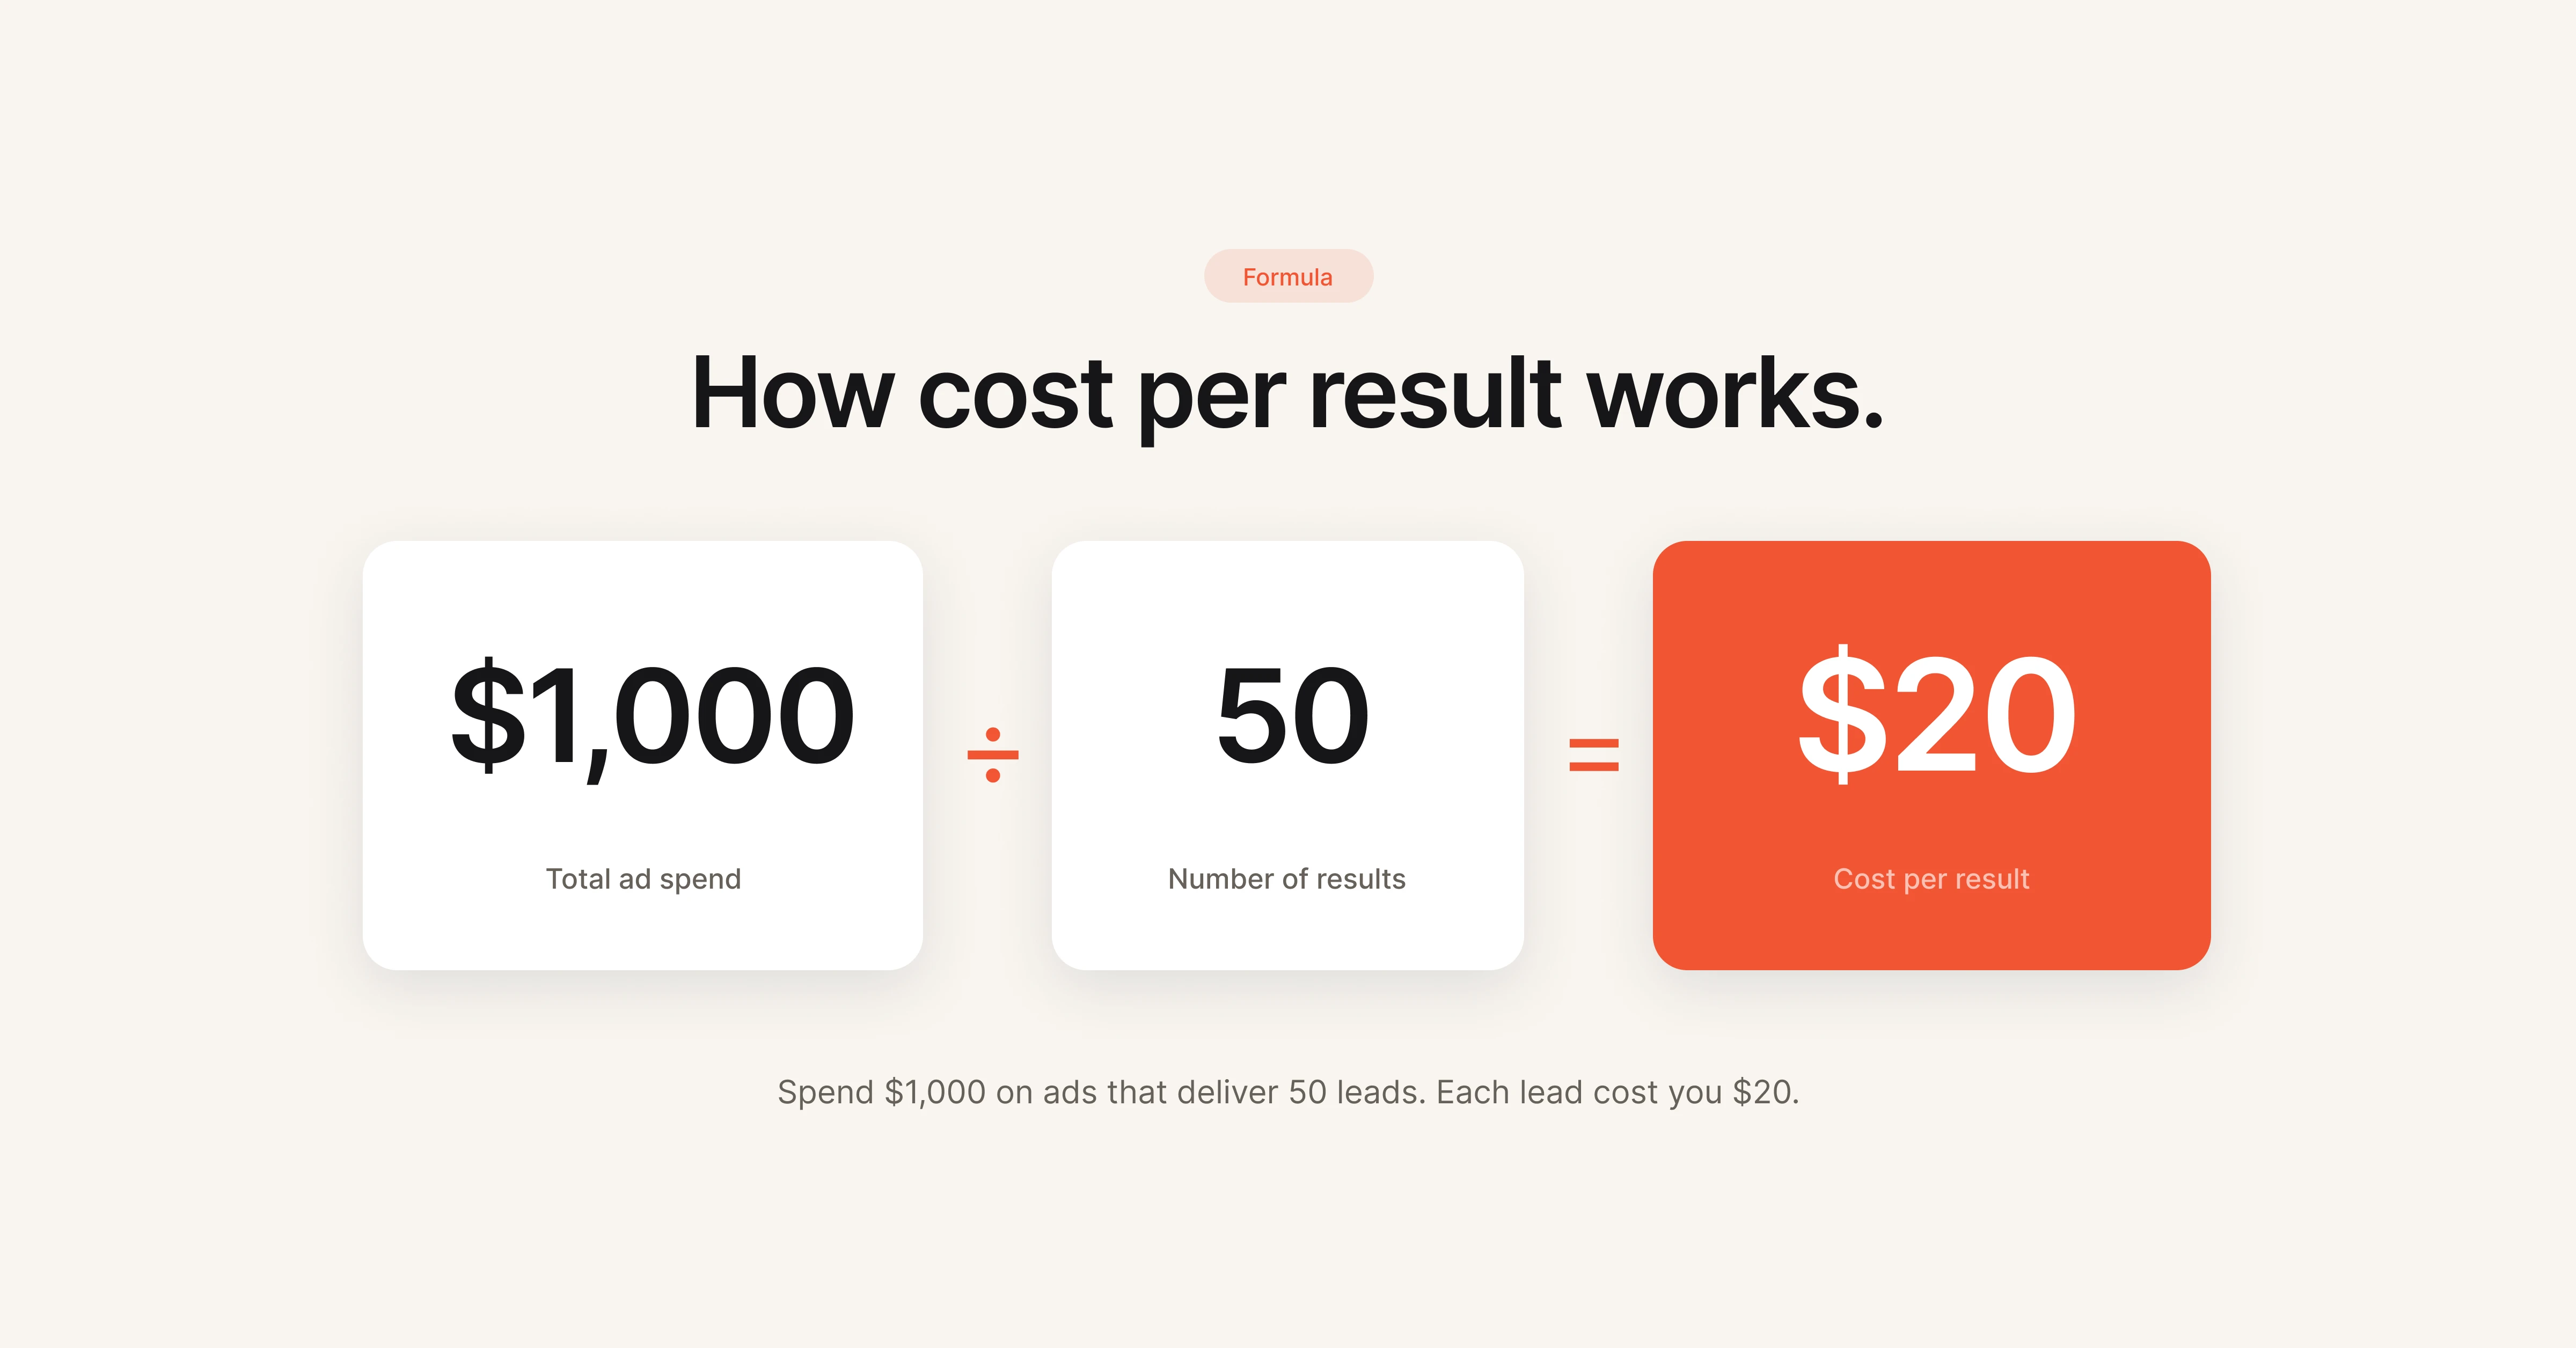
The formula for Cost Per Result is straightforward:
Cost Per Result = Total Ad Spend / Number of Results
For example, if you spent $1,000 on a lead generation campaign and captured 50 leads, your CPR is $20 per lead.
| Scenario | Total Spend | Results | CPR |
|---|---|---|---|
| E-commerce purchases | $2,000 | 80 purchases | $25.00 |
| Lead generation | $1,000 | 50 leads | $20.00 |
| Traffic (link clicks) | $500 | 625 clicks | $0.80 |
| App installs | $3,000 | 300 installs | $10.00 |
| Video views (ThruPlay) | $200 | 2,000 views | $0.10 |
You can find CPR directly in Meta Ads Manager. It's displayed as "Cost per result" in the performance columns of any campaign, ad set, or ad report.
A "good" CPR depends entirely on your campaign objective, industry, funnel stage, and business economics. There is no universal benchmark that applies across all advertisers.
That said, industry data from WordStream and Lebesgue provides useful reference points for 2025-2026:
| Industry | Average CPC | Average CPM | Notes |
|---|---|---|---|
| Travel & Hospitality | $0.42 | $6.96 | Lowest CPC across verticals |
| E-commerce / Retail | $0.70 | $9.80 | High volume, moderate competition |
| Education | $0.77 | $8.50 | Seasonal spikes around enrollment periods |
| Fitness & Wellness | $0.81 | $12.46 | Heaviest CPM inflation in 2025 (+38%) |
| B2B / SaaS | $0.95 | $11.20 | Higher CPR but higher LTV offsets cost |
| Finance & Insurance | $1.05 | $13.48 | Most competitive auction environment |
The median CPA (Cost Per Acquisition) across all industries landed at $38.17 in 2025, with CPMs sitting at $13.48. No industry was spared from rising costs of reach on Meta, with increases ranging from 8% to 38%.
The real question is not "is my CPR good?" but "is my CPR profitable?" A $50 CPR on a product with $200 average order value and 25% margins is a winning campaign. A $5 CPR on leads that never convert to revenue is a losing one.
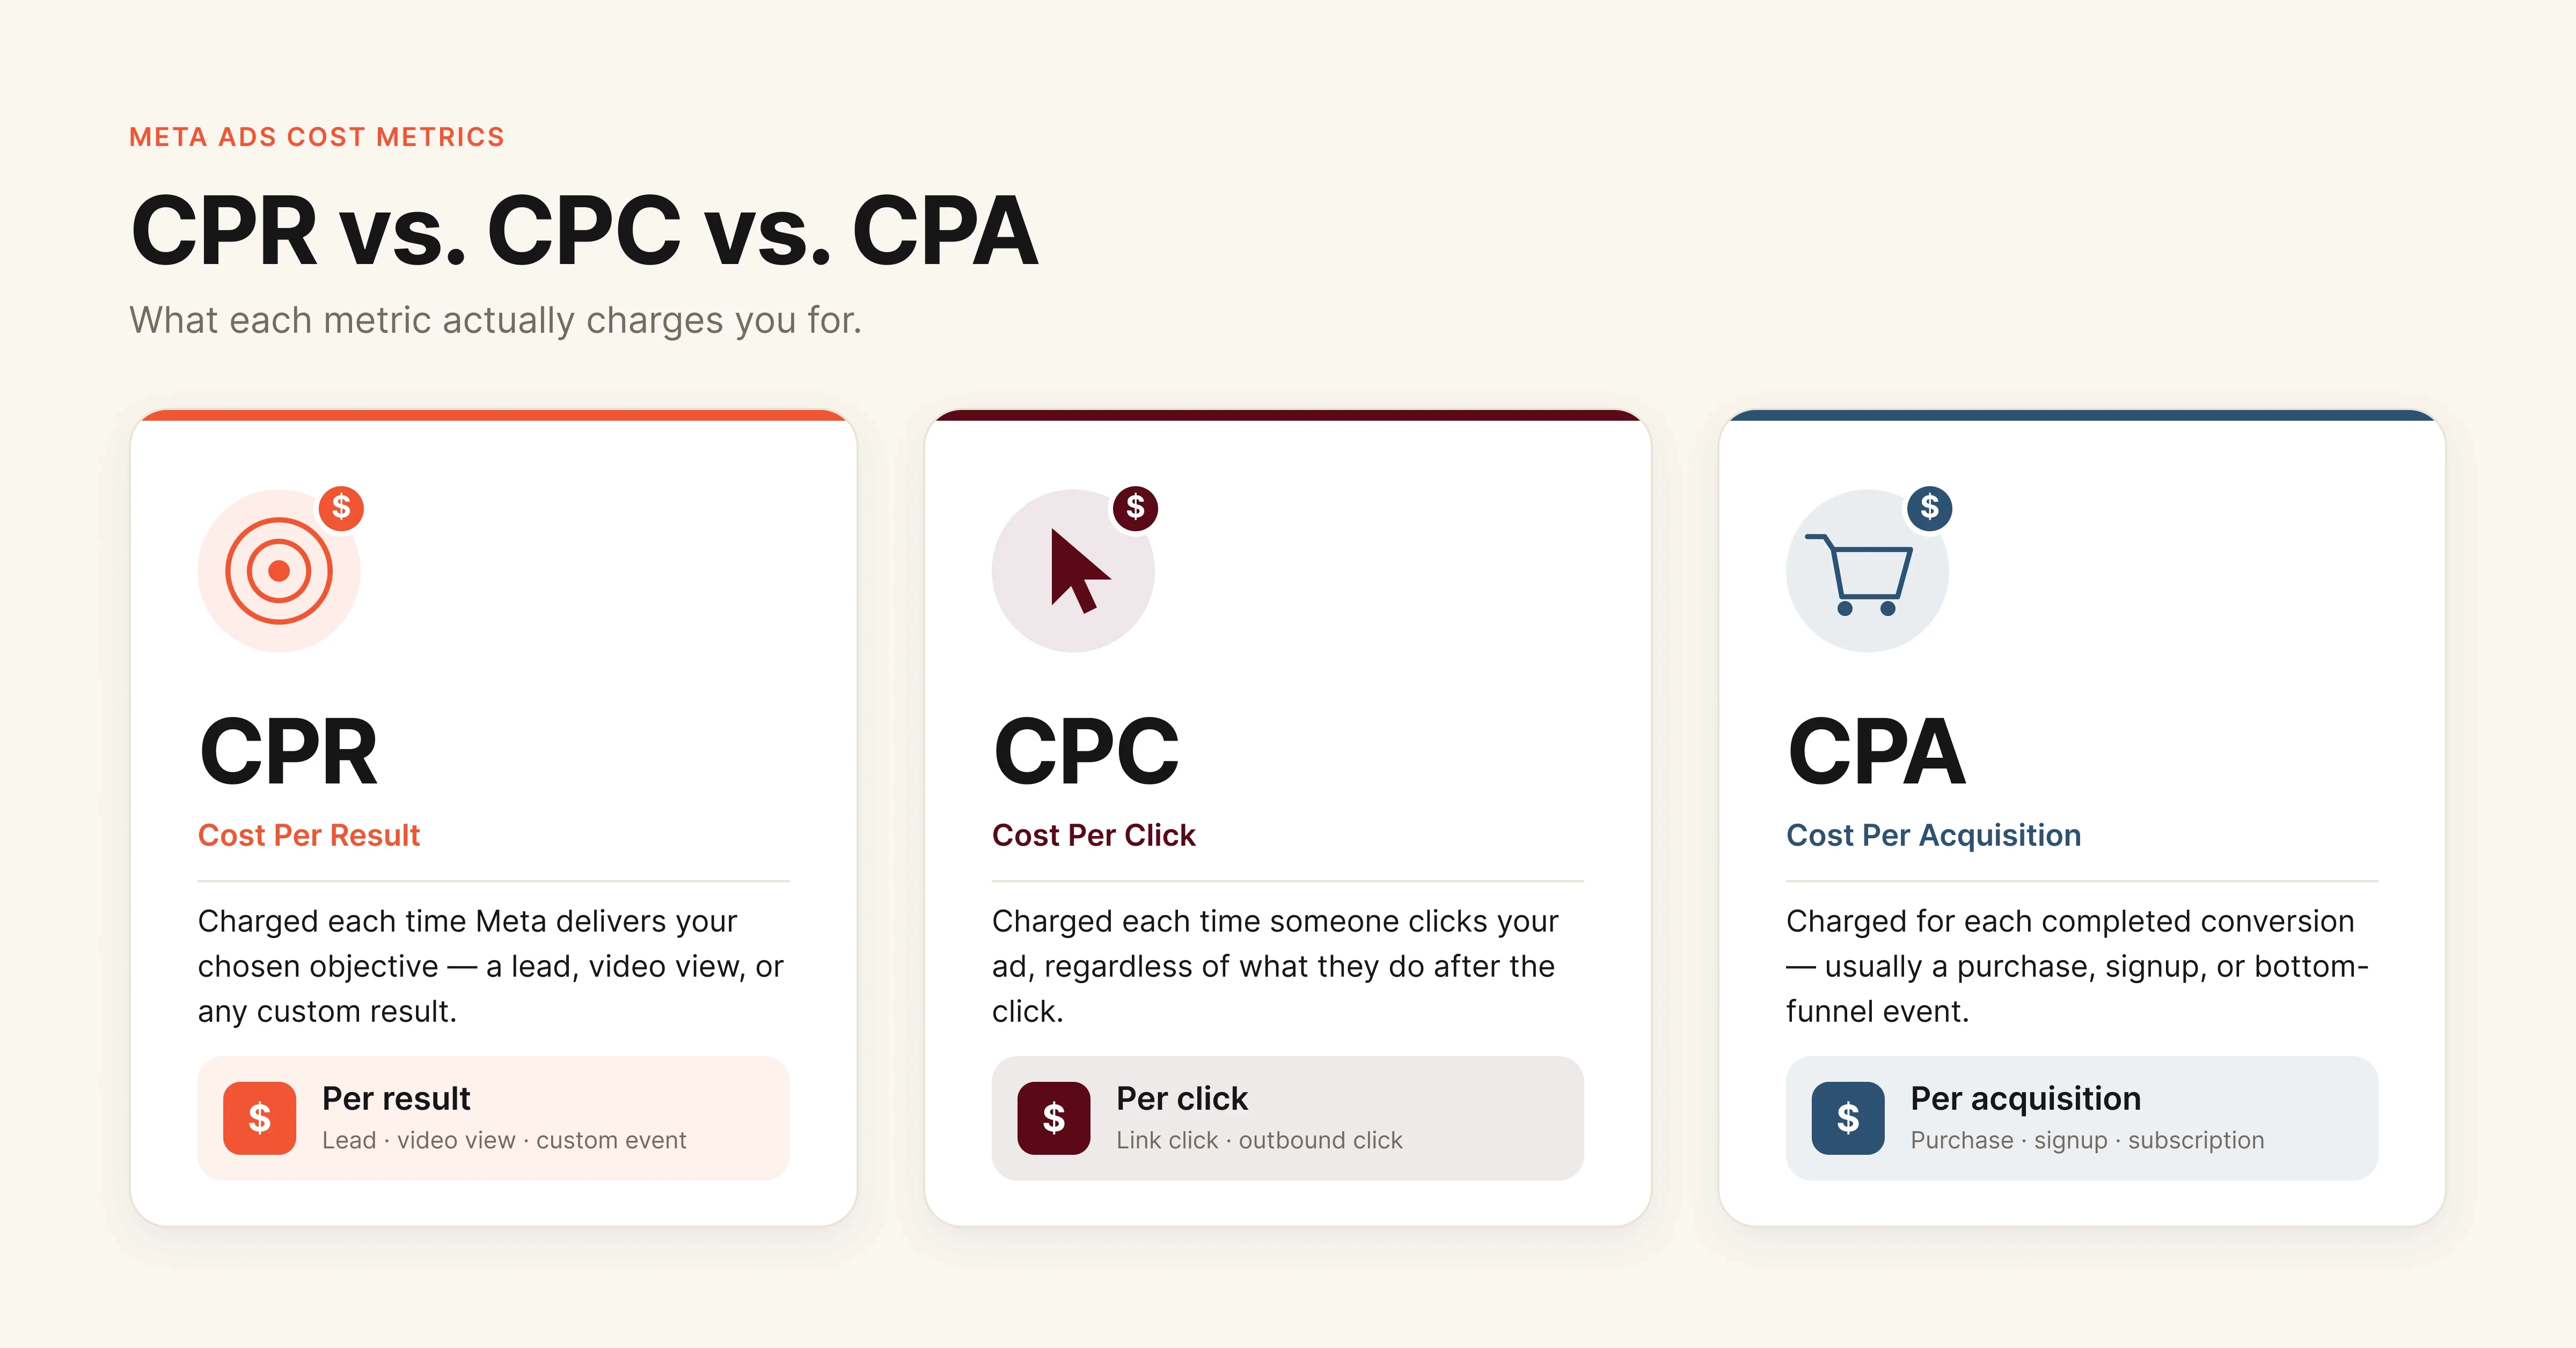
These three metrics are often confused. Here's how they differ:
CPR is the broadest of the three. It adapts to whatever you tell Meta to optimize for. CPC only measures clicks. CPA specifically measures conversions that result in acquisition (purchase, signup, subscription).
In practice, CPR is the metric you'll see most in Ads Manager because Meta ties it directly to your campaign objective. If your objective is leads, CPR equals your CPL. If your objective is purchases, CPR equals your CPA.
Before working through the steps below, make sure you have access to the following:
- Meta Ads Manager with at least 7-14 days of campaign data (avoid optimizing during the learning phase)
- Meta Pixel or Conversions API properly installed and firing on all conversion events
- Audience Insights and Audience Overlap tools within your ad account
- Google Analytics or equivalent to verify post-click behavior and landing page performance
- A creative library with at least 3-5 variations per ad set for testing
If your Pixel isn't tracking correctly, every CPR number you see is unreliable. Fix tracking first.
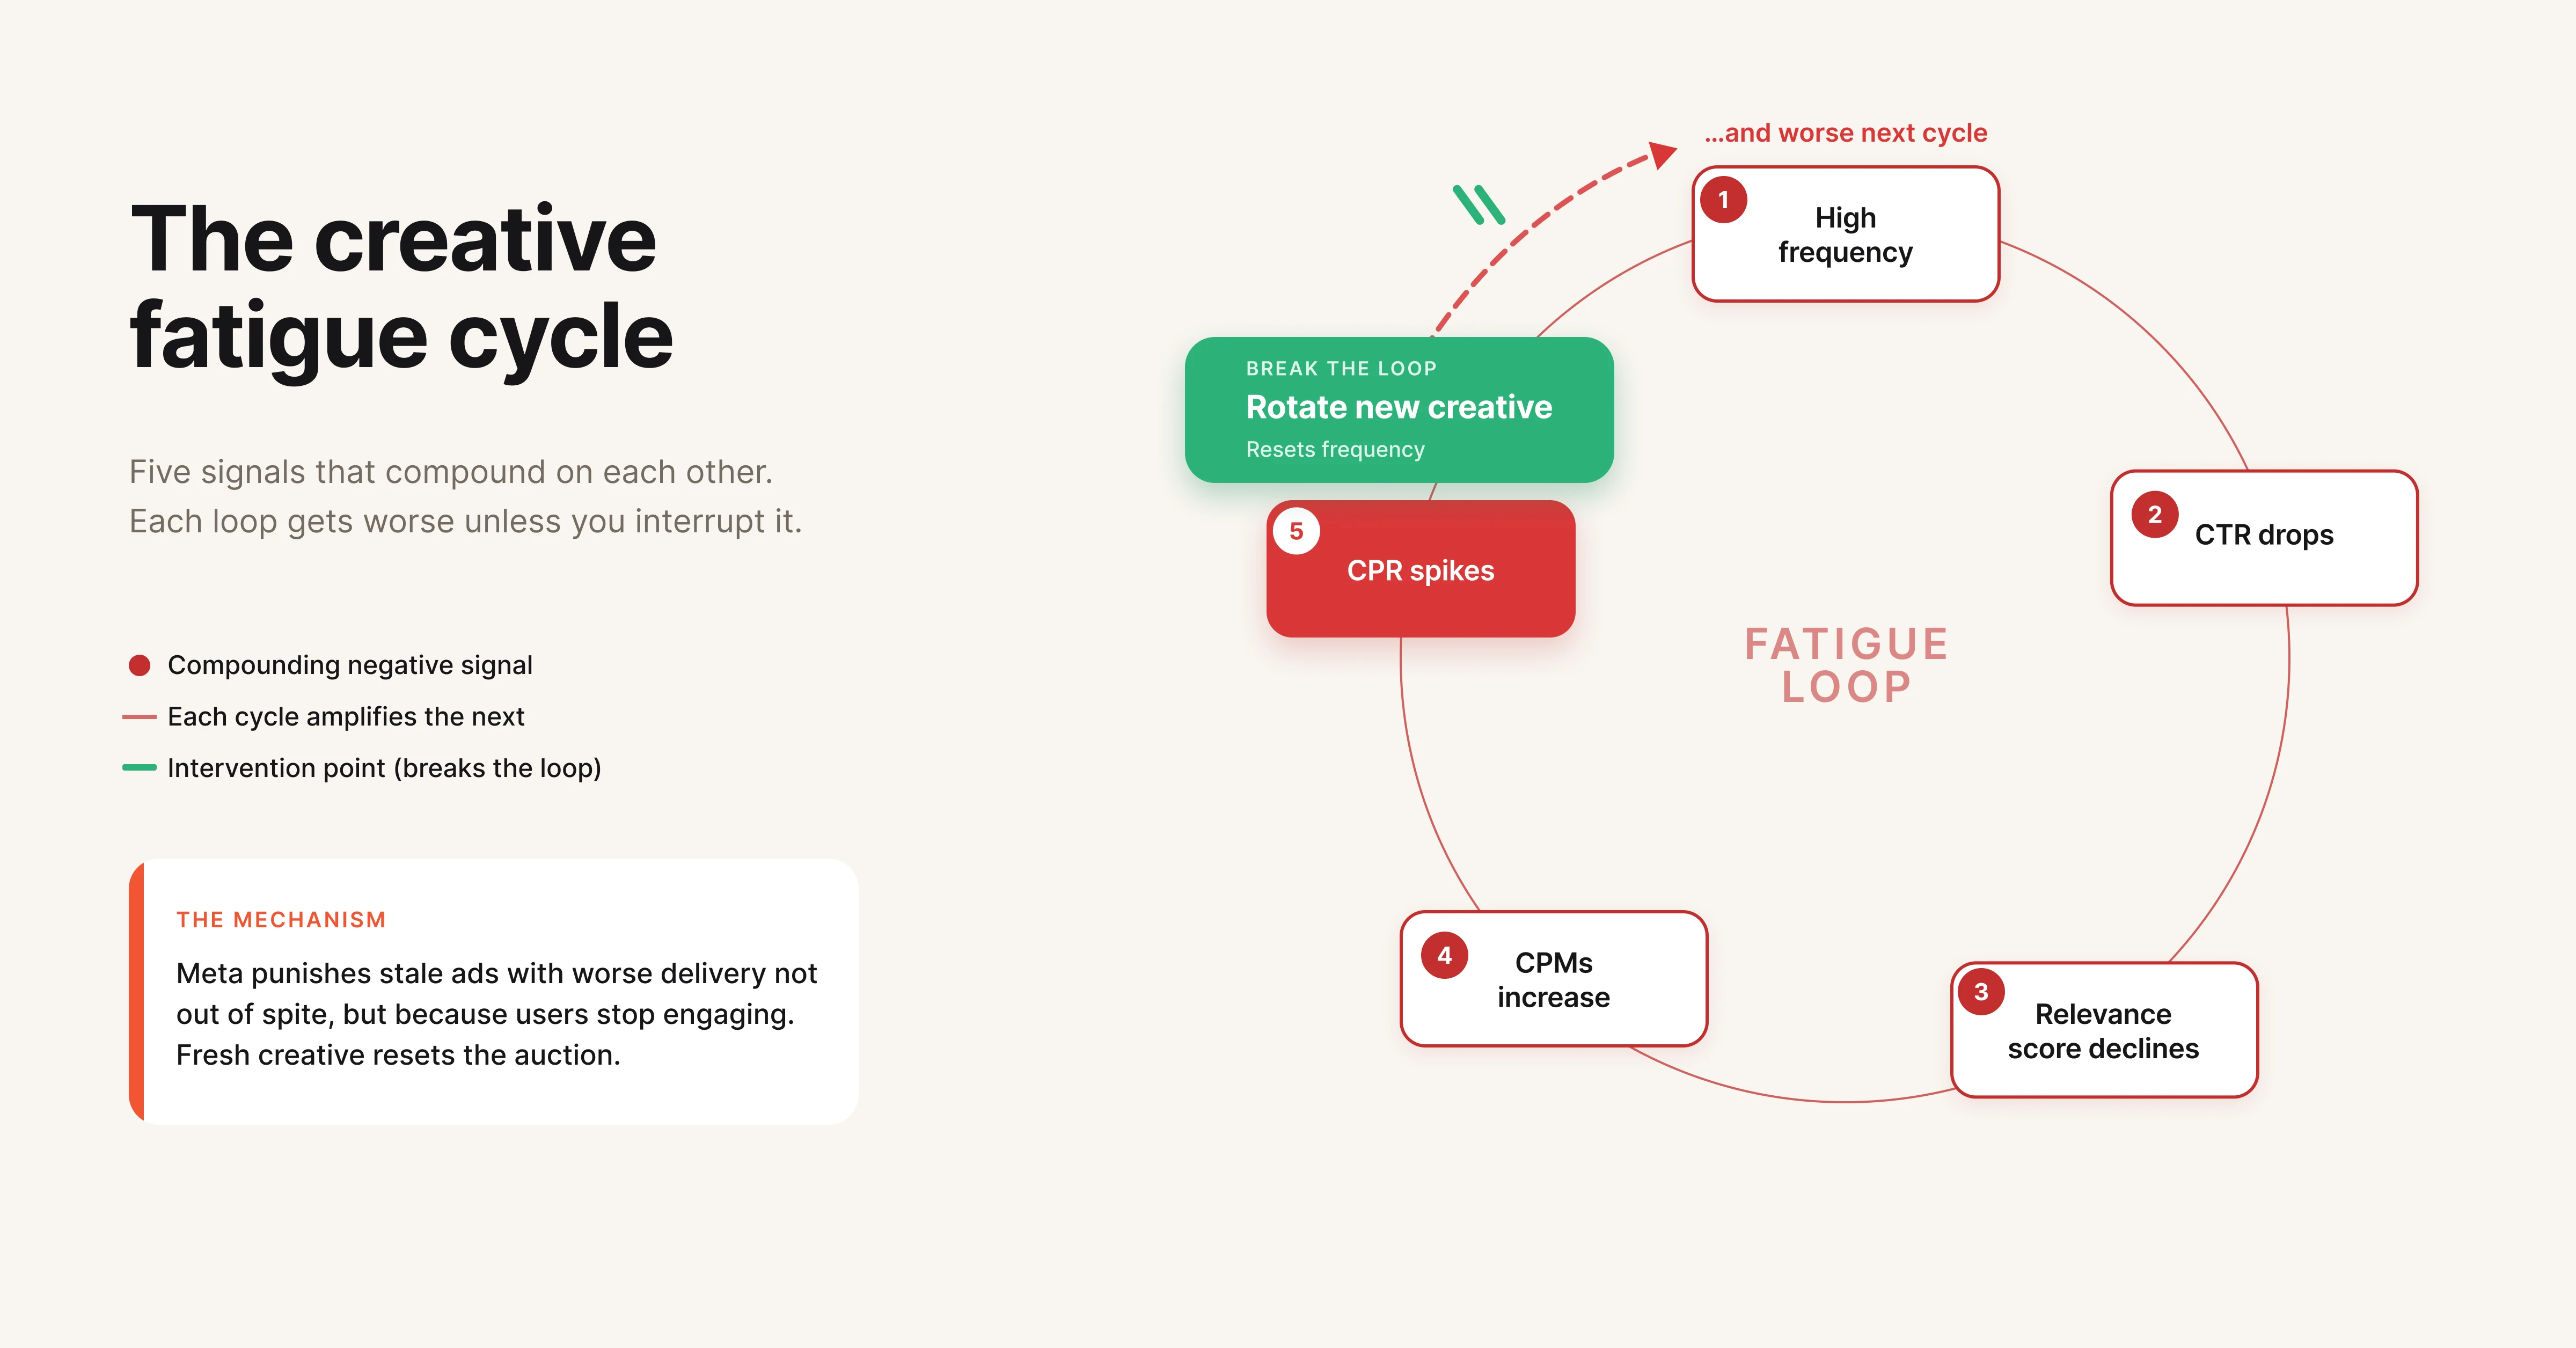
Creative fatigue is the most common and most overlooked driver of rising CPR. It follows a predictable cycle: ad frequency increases, CTR drops, Meta's algorithm flags the ad as less relevant, CPMs rise, and CPR spikes.
Meta defines creative fatigue in two tiers. "Creative Limited" means your CPR is higher than past performance but less than double. "Ad Fatigue" means your CPR has reached 2x or more compared to previous results.
How to spot it:
Check the "Frequency" column in Ads Manager. When frequency climbs above 2.5-3.0 for cold audiences (or 5-6 for retargeting), creative fatigue is likely setting in. Cross-reference with CTR trends. If frequency is rising while CTR is falling, that's your confirmation.
What to do:
Rotate new creative variations before fatigue hits. The goal is proactive replacement, not reactive firefighting. Build a creative pipeline where 2-3 new ad variations are ready to deploy every 2 weeks.
Focus on the elements that drive the most variance in performance: hooks (the first 3 seconds of video or the headline), visual format (static vs. video vs. carousel), and CTA framing. Testing individual elements gives you more signal than swapping entire ads.
Not sure how creative fatigue works at a deeper level? See Creative Fatigue Explained: Why Your Best Performing Ads Stop Working for a full breakdown.
Pro tip: Video ads consistently deliver lower CPR than static images on Meta, particularly when they capture attention within the first 3 seconds. Teams running $50k+/month on Meta typically maintain a 70/30 video-to-static ratio in their ad mix.
Poor targeting forces Meta's algorithm to work harder to find convertible users, which drives up CPR. But the less obvious problem is audience overlap between ad sets.
When multiple ad sets target the same people, they compete against each other in the auction. You're bidding against yourself, and Meta charges you accordingly. This is one of the most expensive mistakes in account structure.
Use Meta's Audience Overlap tool (available in the Audiences section of Ads Manager). Select two or more audiences and compare overlap percentages. Anything above 20-25% overlap is worth consolidating.
Consolidate overlapping ad sets. Use exclusions to separate audiences cleanly (exclude purchasers from prospecting, exclude retargeting audiences from broad targeting). For prospecting, test Advantage+ audience alongside your manual targeting to let Meta's algorithm find pockets of efficiency you might miss.
Retargeting audiences deliver lower CPR because these users already know your brand. But they also saturate fast, especially for smaller brands. Layer your retargeting by recency (3-day, 7-day, 14-day, 30-day website visitors) and serve different messaging at each stage.
A high-converting ad paired with a poor landing page is one of the fastest ways to inflate CPR on conversion campaigns. Meta's algorithm factors post-click behavior into ad delivery. If users bounce quickly, Meta learns that your ad isn't leading to good outcomes and starts charging more to show it.
What to check:
Page load speed should be under 3 seconds on mobile. Use Google PageSpeed Insights to verify. Ensure the landing page matches the ad's message and offer exactly. If your ad promotes 20% off, the landing page should show that discount above the fold, not buried three scrolls down.
Strip unnecessary elements from landing pages. Remove navigation menus, sidebar widgets, and anything that competes with the primary CTA. Mobile optimization matters disproportionately since over 75% of Meta ad traffic is mobile.
Test dedicated landing pages against your standard product or signup pages. In most cases, a focused landing page with a single CTA outperforms a general-purpose page by 20-40% on conversion rate, which directly reduces CPR. If your ads are getting clicks but not converting, this guide on why Meta Ads aren't converting covers the full diagnostic process.
Your bid strategy tells Meta how aggressively to compete in the auction, and it has a direct impact on CPR.
Bid strategy options and when to use them:
| Strategy | Best For | CPR Impact |
|---|---|---|
| Lowest Cost (default) | Maximizing results within budget | Can spike CPR during scaling |
| Cost Per Result Goal | Maintaining stable CPR at target | Best for predictable unit economics |
| ROAS Goal | Revenue optimization | Focuses on value, not volume |
| Bid Cap | Maximum cost control | Limits delivery if cap is too low |
For most advertisers optimizing CPR, Cost Per Result Goal is the right starting point. Set it at your current average CPR and lower it gradually (5-10% per week) as performance stabilizes.
Pair this with Campaign Budget Optimization (CBO), which lets Meta distribute budget across ad sets based on real-time performance. CBO typically outperforms manual budget allocation for accounts with 3+ ad sets because it responds to auction dynamics faster than manual adjustments.
Different ad formats carry different CPRs. Video ads on Reels often deliver 30-50% lower CPR than static images in the feed, but only if the creative is native to the format.
Format performance hierarchy (general benchmarks):
- Reels video: Lowest CPR, highest engagement
- In-feed video (under 15 seconds): Strong CPR, broad reach
- Carousel: Good for e-commerce, moderate CPR
- Static image: Highest CPR on average, but fastest to produce
- Stories: Low CPR but shorter shelf life
Don't just test formats. Test placements. Advantage+ Placements lets Meta serve ads across Facebook, Instagram, Messenger, and the Audience Network (all part of the Meta ecosystem). In most cases, this outperforms manual placement selection because Meta can find cheaper inventory automatically.
However, review placement breakdowns in reporting. If a specific placement (like Audience Network) is eating budget with low conversion rates, exclude it and let Meta optimize across the remaining inventory.
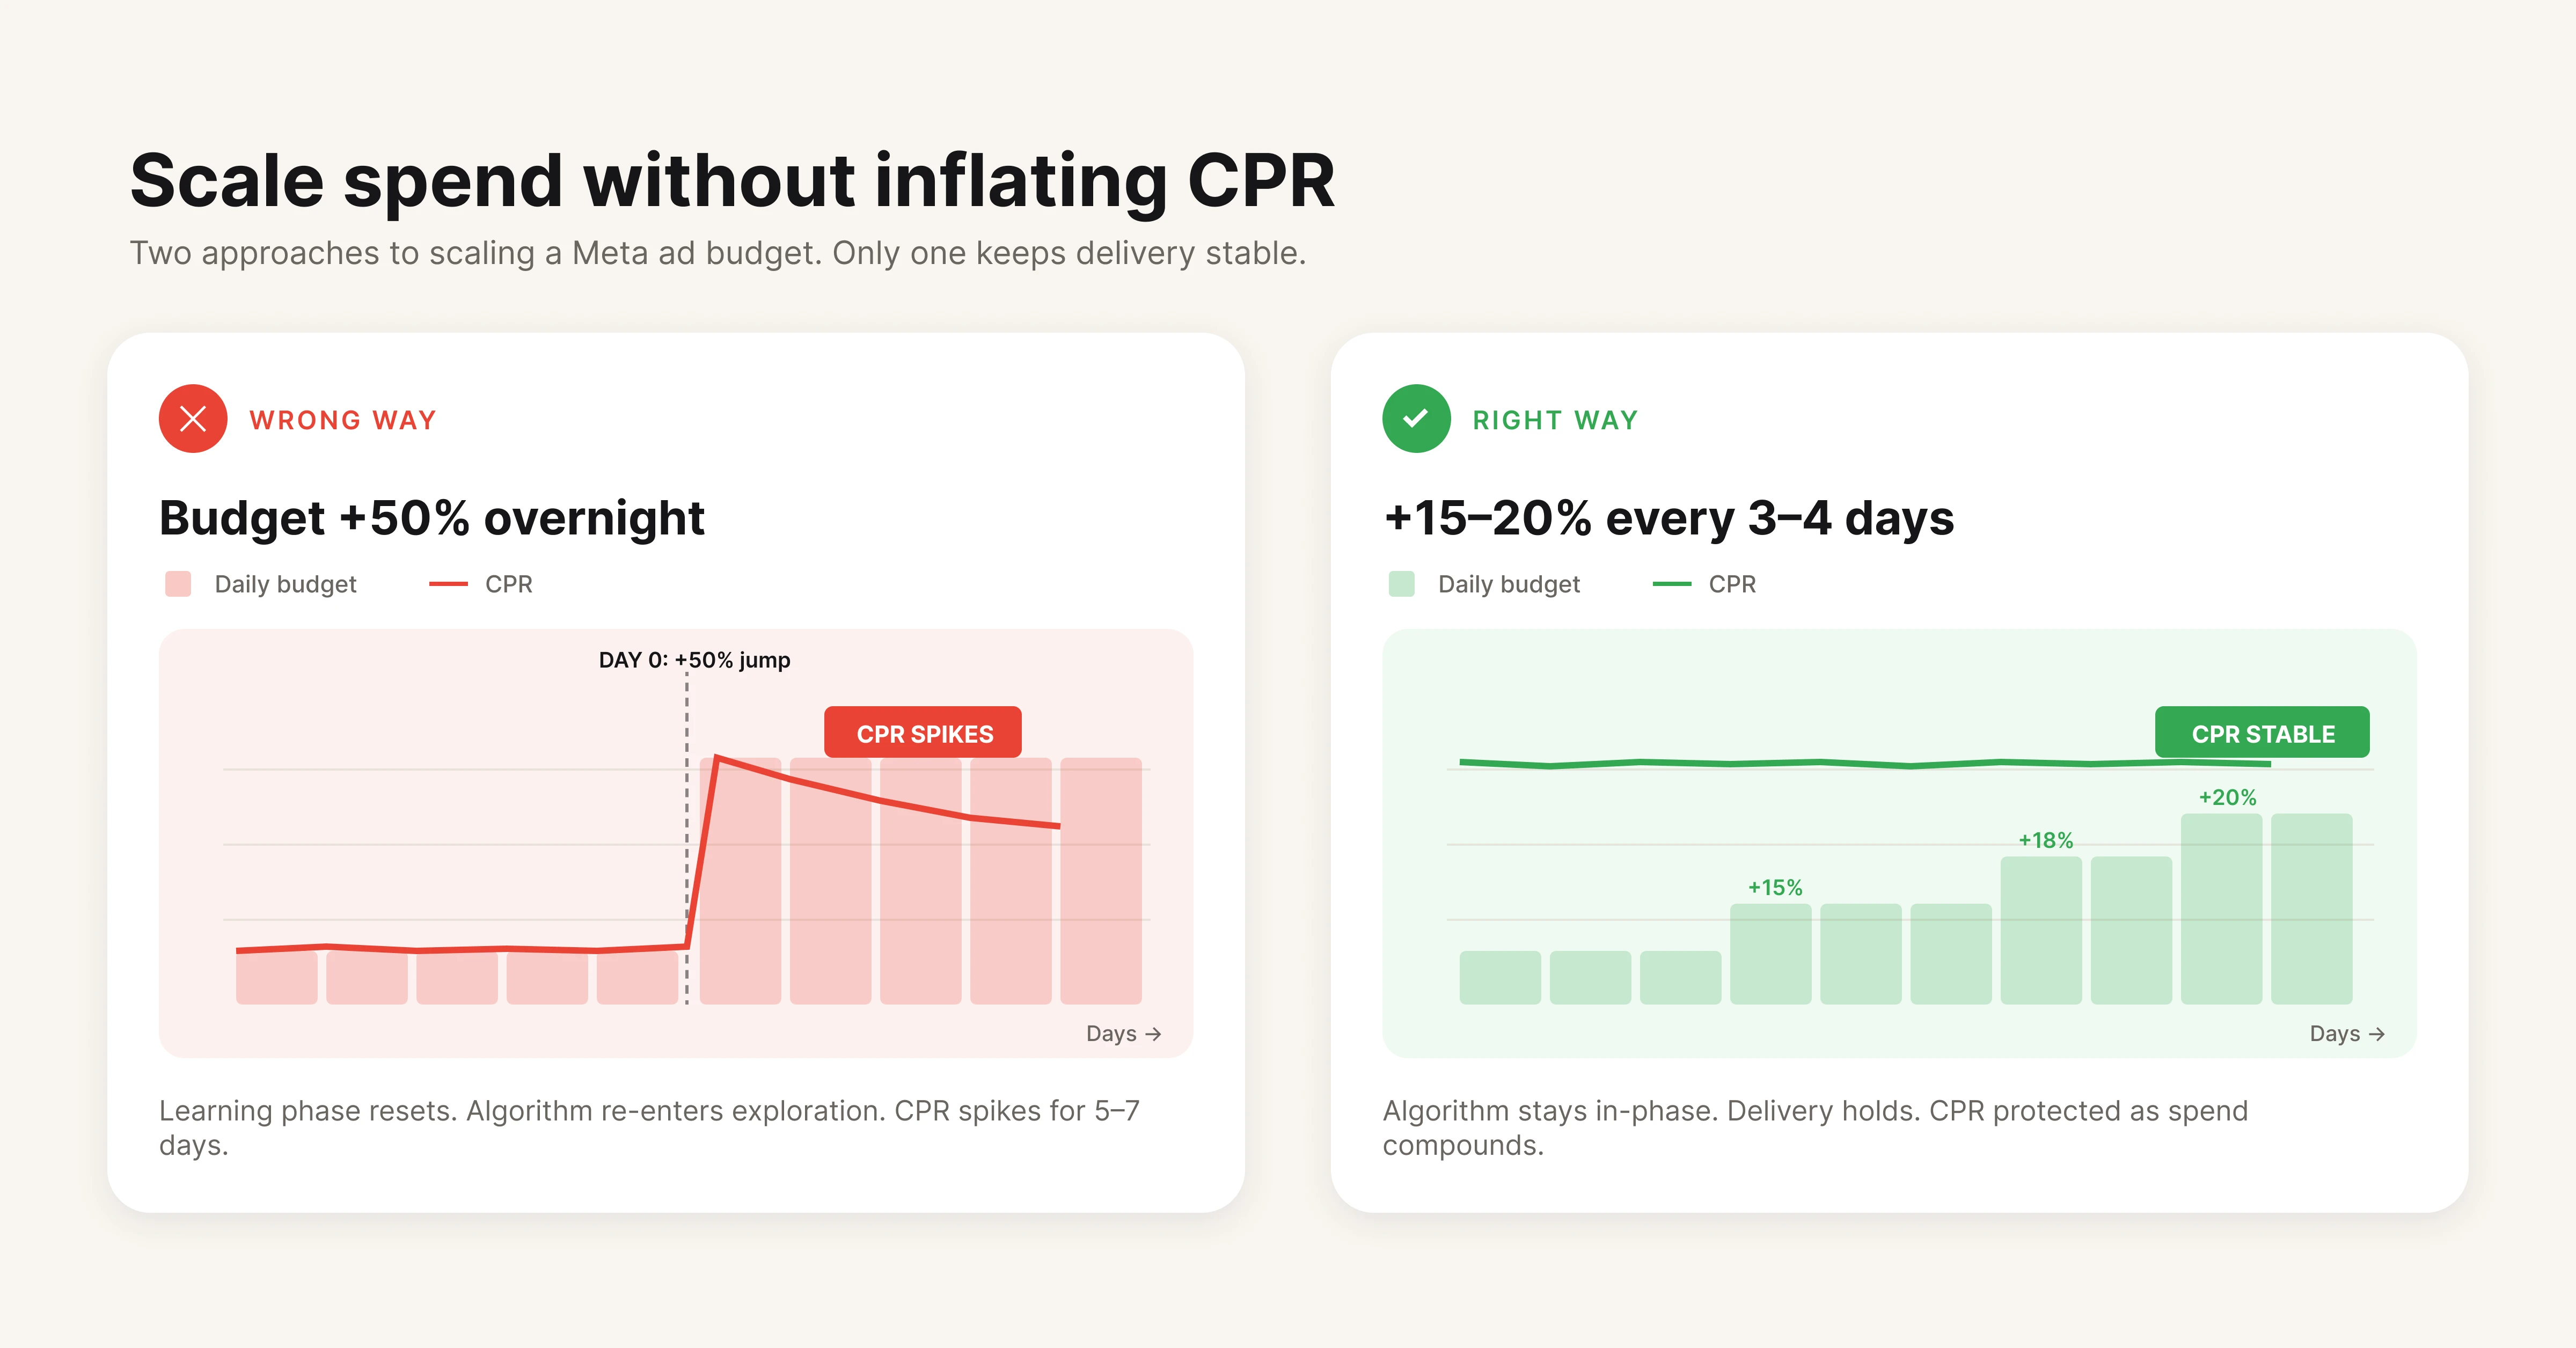
Scaling is where CPR management gets hard. Increasing budget by 20%+ overnight typically triggers a learning phase reset, causing CPR to spike temporarily.
The safe scaling approach:
Increase budget by no more than 15-20% every 3-4 days. This gives Meta's algorithm time to adjust without a full learning phase reset. Monitor CPR for 48-72 hours after each increase before making another adjustment.
For faster scaling, duplicate high-performing ad sets into new campaigns rather than increasing budget on the original. This preserves the original ad set's optimization data while the duplicate finds its own equilibrium.
Horizontal scaling (expanding to new audiences) is more sustainable than vertical scaling (increasing budget on existing audiences). When you hit diminishing returns on one audience, launch a new ad set targeting a different segment rather than forcing more spend into a saturated one.
Several common mistakes silently inflate CPR across accounts of all sizes. Most are structural problems, not creative ones.
Editing active ad sets during the learning phase. Any significant edit (budget changes over 20%, audience changes, creative swaps) resets the learning phase. Meta needs approximately 50 conversion events per ad set per week to exit learning. Resetting it forces you to pay the learning tax again.
Ignoring Advantage+ campaign types. Meta's Advantage+ Shopping Campaigns and Advantage+ App Campaigns use machine learning to automate targeting, creative selection, and budget allocation. For e-commerce brands, Advantage+ Shopping campaigns have shown 12-15% lower CPAs compared to manual campaign structures in Meta's own case studies.
Running too many ad sets with small budgets. Spreading $50/day across 10 ad sets means each one gets $5. That's not enough for Meta's algorithm to learn or optimize. Consolidate into fewer ad sets with higher budgets and let CBO handle distribution.
Neglecting post-click experience. Your ad can have a 5% CTR, but if the landing page converts at 1% instead of 3%, your CPR for conversions triples. The cheapest CPR improvement is often on the landing page, not in the ad account.
Using broad targeting without creative volume. Advantage+ audience and broad targeting work well when you feed Meta enough creative variations (5-10+ per ad set) to test. Running broad targeting with a single ad gives Meta no signals to optimize toward.
Meta Ads Manager (built-in). The native platform gives you CPR data, frequency monitoring, audience overlap analysis, and A/B testing. Start here. Most CPR problems can be diagnosed without third-party tools.
Hawky. Hawky's element-level creative analysis breaks down ad performance by hook, visual, body copy, and CTA individually. Instead of guessing which creative "works," you see exactly which elements drive lower CPR across your entire ad library. For teams running multiple creatives, Hawky's creative fatigue detection flags ads approaching fatigue before CPR starts climbing, so you can rotate proactively. Hiveminds used Hawky to cut CPL by 27% and saved 160+ hours per brand monthly by identifying underperforming creative elements faster.
Google Analytics / GA4. Essential for understanding post-click behavior. If users click your ad but bounce from the landing page, GA4 shows you where the funnel breaks, which is critical context that Ads Manager alone can't provide.
For a deeper look at creative testing frameworks, see How to Find Your Winning Creative with Data. If you're evaluating creative intelligence tools, check out 9 Best Ad Creative Analysis Tools in 2026.
Google PageSpeed Insights. Free tool for diagnosing landing page speed issues. If your mobile page takes more than 3 seconds to load, fix it before touching anything in your ad account.
Triple Whale / Northbeam. Attribution platforms that give a clearer picture of true CPR across channels, especially useful post-iOS 14 when Meta's reported conversions may not match reality.
What is a good cost per result in Meta Ads?
A good cost per result depends on your campaign objective, industry, and business economics. For traffic campaigns, $0.50 to $2.00 per click is typical. For lead generation, $5 to $30 per lead is common depending on industry.
For e-commerce purchases, anything below your break-even CPA (factoring in margins and LTV) is considered profitable. The 2025-2026 median CPA across all industries on Meta is approximately $38.
How is cost per result different from cost per click?
Cost Per Result (CPR) measures the cost of achieving whatever outcome your campaign is optimized for, which could be a click, a lead, a purchase, or a video view. Cost Per Click (CPC) only measures the cost per link click, regardless of what happens after. If your campaign objective is conversions, your CPR reflects cost per conversion while CPC only shows what you paid for clicks.
Why is my Meta Ads cost per result so high?
The most common causes of high CPR are creative fatigue (ads shown too frequently to the same audience), poor audience targeting or audience overlap between ad sets, slow or mismatched landing pages, insufficient creative variations for the algorithm to optimize, and campaigns stuck in the learning phase. Check your ad frequency first. If it's above 3.0 for prospecting audiences, creative fatigue is likely the primary driver.
Can I set a cost per result goal in Meta Ads?
Yes. Meta offers a "Cost Per Result Goal" bid strategy that tells the algorithm to target a specific average CPR. Set it at or slightly above your current average CPR, then lower it gradually as performance stabilizes. Keep in mind that setting the goal too low will restrict delivery, meaning Meta won't spend your full budget if it can't find results at your target price.
How does creative fatigue affect cost per result?
Creative fatigue follows a predictable pattern. As ad frequency increases, CTR decreases. Lower CTR signals to Meta's algorithm that the ad is less relevant, which reduces your relevance score.
Lower relevance means higher CPMs (Meta charges more to show underperforming ads), and higher CPMs directly increase CPR. Meta classifies this into two tiers: "Creative Limited" (CPR higher than historical average) and "Ad Fatigue" (CPR at 2x or more of historical average).
Does Advantage+ actually lower cost per result?
Advantage+ campaigns use Meta's machine learning to automate audience targeting, creative optimization, and budget allocation. For e-commerce brands, Meta reports that Advantage+ Shopping Campaigns deliver 12-15% lower CPAs on average compared to manual campaigns. Results vary by account, but the automation removes human targeting biases and lets the algorithm explore audience segments that manual setups might miss.
If your CPR keeps climbing and you can't pinpoint why, the issue is almost always creative. Either the ads are fatigued, the elements aren't resonating, or you're running too few variations for the algorithm to work with. Hawky's creative analysis breaks down every ad by hook, visual, CTA, and body copy so you can see exactly where the problem is, and what to test next.