ROAS Benchmarks by Industry in 2026: What's a Good Number and How to Beat It

ROAS (Return on Ad Spend) benchmarks vary dramatically by industry, ranging from 2.3x in healthcare to 8.0x in legal services. The average ROAS across industries in 2026 sits at approximately 5.3x for paid search, but that number means nothing without context. Your margins, your platform mix, and your creative strategy determine whether a 3x ROAS is a win or a warning sign.
This guide breaks down ROAS benchmarks by industry and platform, explains how to calculate your own break-even ROAS, and gives you specific tactics to outperform your vertical's average. No generic advice. Just data and the playbook to act on it.
ROAS (Return on Ad Spend) is a marketing metric that measures how much revenue you generate for every dollar spent on advertising. It is the most commonly used metric for evaluating the efficiency of paid media campaigns across platforms like Google Ads, Meta, and TikTok.
The formula is straightforward:
ROAS = Revenue from Ads / Ad Spend
If you spend $10,000 on Meta ads and those ads generate $40,000 in revenue, your ROAS is 4.0x (or 400%). You earned $4 for every $1 spent.
ROAS is typically expressed as a multiple (4.0x) or a ratio (4:1). Both mean the same thing. Some platforms and reports express it as a percentage (400%), which can cause confusion. Stick with the multiple for clarity.
One critical distinction: ROAS measures revenue, not profit. A 4.0x ROAS looks healthy until you factor in product costs, shipping, payment processing fees, and overhead. That's why understanding your break-even ROAS matters more than chasing an arbitrary benchmark.
Google's own advertising documentation uses 2:1 as the default ROAS baseline for Google Ads, meaning $2 in revenue for every $1 spent. Most performance marketers would consider that the floor, not the target.
A good ROAS in 2026 depends entirely on your profit margins, industry, and business model. The commonly cited "rule of thumb" is 3:1, meaning $3 in revenue for every $1 in ad spend. For many ecommerce businesses, that's a reasonable starting point, but it's not universal.
Here's the logic: if your average profit margin is 30%, you need at least a 3.3x ROAS just to break even on ad spend. Every dollar below that threshold means you're losing money on acquisition. Every dollar above it is actual profit from paid media.
The median ROAS across Google Ads campaigns sits at approximately 3.5:1 in 2026. The average across all industries and platforms is higher at 5.3:1, but that number is heavily skewed by high-margin industries like legal services and B2B software.
| ROAS Range | What It Means |
|---|---|
| Below 2.0x | Likely unprofitable unless margins exceed 50% or LTV is very high |
| 2.0x to 3.0x | Break-even territory for most businesses. Acceptable for new customer acquisition |
| 3.0x to 5.0x | Solid performance. Profitable for most margin structures |
| 5.0x to 8.0x | Strong performance. Indicates efficient targeting and strong creative |
| Above 8.0x | Exceptional. Often seen in retargeting campaigns or high-margin verticals |
The real benchmark isn't an industry average. It's your break-even ROAS, which you can calculate using your own margin data. More on that below.
ROAS benchmarks vary significantly across industries due to differences in average order value, profit margins, sales cycles, and competitive intensity. The following table shows 2026 ROAS benchmarks across major industries based on aggregated data from multiple sources.
| Industry | Average ROAS | Notes |
|---|---|---|
| Legal Services | 8.0:1 | High case values drive exceptional returns per click |
| Travel & Hospitality | 6.5:1 | High AOV bookings with strong intent signals |
| Toys & Games | 6.0x | Seasonal spikes, impulse-purchase behavior |
| B2B/Technology | 5.0:1 | Longer sales cycles but high contract values |
| Real Estate | 5.0:1 | High transaction values, local search dominance |
| Home Services | 5.0:1 | Strong local intent, service-based margins |
| Healthcare | 5.0:1 | Complex compliance, but high patient LTV |
| Supplements & Health (DTC) | 4.5x | High subscription attach rates (52% avg) |
| Apparel & Fashion | 4.3x | Volume-driven, heavy creative rotation needed |
| Sporting & Fitness | 4.3x | Seasonal peaks, enthusiast audiences |
| Beauty & Personal Care | 4.2x | Strong social performance, high repeat rates |
| Art & Collectibles | 5.1x | High margins, niche audiences |
| Pet Products | 4.1x | Growing vertical, repeat purchase behavior |
| Ecommerce (General) | 4.0:1 | Broad category, highly variable by sub-niche |
| Food & Beverage | 3.6x | Shipping costs compress margins |
| Consumer Electronics | 3.8x | Price-competitive, margin pressure |
| Jewelry & Accessories | 4.0x | High AOV, gift-driven purchasing |
Key takeaway: The gap between the highest-performing industry (legal at 8.0:1) and general ecommerce (4.0:1) is 2x. That gap widens further when you compare platforms, customer types, and campaign objectives.
Geography also matters. ROAS can swing by 2-4x within the same industry based on location alone. A fashion brand running Meta ads in Southeast Asia will see fundamentally different results than the same brand targeting the US.
Industry-level benchmarks also shift year over year. According to Statista's digital advertising reports, global digital ad spending continues to rise, pushing CPMs higher and compressing ROAS across categories. The average ecommerce ROAS dropped 4% year-over-year in 2025, landing at 2.87x. Competition is increasing faster than conversion rates, which means static ROAS targets need annual recalibration.
Platform selection has a massive impact on ROAS. Google Ads consistently delivers the highest average ROAS because it captures high-intent search traffic. Users on Google are actively looking for solutions. Users on Meta and TikTok are being interrupted with ads while browsing content.
Google Ads ROAS Benchmarks
| Campaign Type | Average ROAS |
|---|---|
| Search Ads | 6.0x to 8.0x |
| Shopping Ads | 5.0x to 6.5x |
| Display Network | 2.5x to 4.0x |
| YouTube Ads | 2.0x to 3.5x |
Google Search captures the highest-intent users, which is why search campaigns dominate ROAS rankings. Shopping ads benefit from visual product placement and purchase-ready audiences. Display and YouTube serve awareness and consideration objectives, where lower ROAS is expected but justified by broader reach.
Meta Ads (Facebook and Instagram) ROAS Benchmarks
| Category | Average ROAS |
|---|---|
| Overall (blended) | 2.5x to 4.0x |
| Impulse purchases (apparel, beauty) | 3.0x+ |
| High-ticket items (furniture, electronics) | 1.8x to 2.5x |
| Retargeting campaigns | 5.0x to 10.0x+ |
Meta's algorithm favors broad targeting through Advantage+ Shopping campaigns, which often outperform interest-based targeting for ROAS in 2026. Brands spending $50k or more per month on Meta typically report creative refresh cycles of 2-3 weeks before ad fatigue starts dragging down returns.
TikTok Ads ROAS Benchmarks
| Category | Average ROAS |
|---|---|
| Platform Average | 1.7x |
| Beauty & Personal Care | 3.5x |
| Apparel & Accessories | 2.8x |
| Entertainment & Media | 2.5x |
TikTok's ROAS benchmarks trail Google and Meta, but the platform is still maturing its ad products and expanding its ad measurement capabilities. Attribution windows are shorter and less reliable, which means actual TikTok-driven revenue is likely higher than reported numbers suggest. Brands using TikTok for top-of-funnel awareness should evaluate it on blended ROAS across all channels rather than in isolation.
Channel Comparison: Paid vs. Organic
For perspective, here's how paid channels stack up against organic:
| Channel | Average ROAS |
|---|---|
| SEO | 9.10x |
| Webinars | 4.95x |
| Email Marketing | 3.50x |
| Influencer Marketing | 3.45x |
| PPC/SEM | 1.55x |
| Facebook Ads | 1.80x |
Organic channels consistently outperform paid channels on ROAS. This doesn't mean paid is inefficient. It means a diversified marketing mix that includes strong SEO, email, and content foundations will make your paid spend more efficient overall.
The practical takeaway: brands that invest in organic channels alongside paid advertising see higher blended ROAS because organic revenue dilutes the cost base. A brand generating 40% of revenue from SEO and email can tolerate lower paid ROAS on prospecting campaigns because the overall marketing efficiency is strong. Brands fully dependent on paid media need every campaign to carry its own weight, which creates a fragile growth model.
Most ROAS benchmarks treat all customers as equal. They're not. The gap between new customer acquisition ROAS and repeat customer ROAS is one of the most important distinctions performance marketers overlook.
Q1 2026 data from DTC brands tells the story clearly:
| Vertical | New Customer ROAS | Repeat Customer ROAS | Gap |
|---|---|---|---|
| Supplements & Health | 2.3x | 9.1x | 3.9x |
| Beauty & Personal Care | 2.1x | 8.4x | 4.0x |
| Pet Products | 2.0x | 8.2x | 4.1x |
| Apparel & Fashion | 1.9x | 6.8x | 3.6x |
| Food & Beverage | 1.8x | 7.1x | 3.9x |
Repeat customers deliver 3-4x higher ROAS than new customers across every DTC vertical. This has two major implications for how you interpret benchmarks.
First, if your blended ROAS looks strong but you're mostly retargeting existing customers, you're not actually growing. High blended ROAS can mask a customer acquisition problem.
Second, if your new customer acquisition ROAS is 2.0x and your industry benchmark is 4.0x, you're not necessarily underperforming. You might just be spending more aggressively on prospecting, which is the harder (and more valuable) work.
Brands with strong subscription attach rates (supplements at 52%, food at 41%) can afford lower acquisition ROAS because lifetime value justifies the upfront cost. If you're running a subscription model, your break-even ROAS calculation should factor in projected LTV, not just first-purchase revenue.
ROAS and ROI are related but measure different things. Confusing them leads to bad decisions, and it happens constantly. ROAS measures the ratio of revenue to ad spend. ROI measures the ratio of profit to total investment.
| Metric | Formula | Measures |
|---|---|---|
| ROAS | Revenue from Ads / Ad Spend | Advertising efficiency (revenue) |
| ROI | (Profit from Campaign - Total Cost) / Total Cost | Overall profitability |
Here's where the gap matters. A campaign with a 4.0x ROAS generating $40,000 in revenue from $10,000 in ad spend looks great on paper. But if your COGS is $20,000, shipping costs $4,000, and platform fees eat another $2,000, your actual profit is $4,000. Your ROI is 40%, not 300%.
ROAS is a useful operational metric for comparing campaigns, platforms, and creative performance within your ad accounts. ROI is what actually tells you whether the business made money. Smart marketers track both.
Some teams now use a metric called NPOAS (Net Profit on Ad Spend), which deducts all costs from revenue before dividing by ad spend. It gives a clearer picture of true campaign profitability. If your analytics stack supports it, NPOAS is worth tracking alongside standard ROAS.
NPOAS = (Revenue from Ads - All Costs) / Ad Spend
A campaign with 4.0x ROAS might only deliver 0.4x NPOAS once all costs are deducted. That's the difference between a number that looks good in a report and a number that tells you whether you're actually making money. Performance marketers who track NPOAS make better budget allocation decisions because they're optimizing for profit, not vanity metrics.
Your break-even ROAS is the minimum ROAS needed to cover all costs associated with fulfilling the orders generated by your ads. Every campaign that exceeds this number is profitable. Every campaign below it is losing money, regardless of what the industry benchmark says.
Here's how to calculate it:
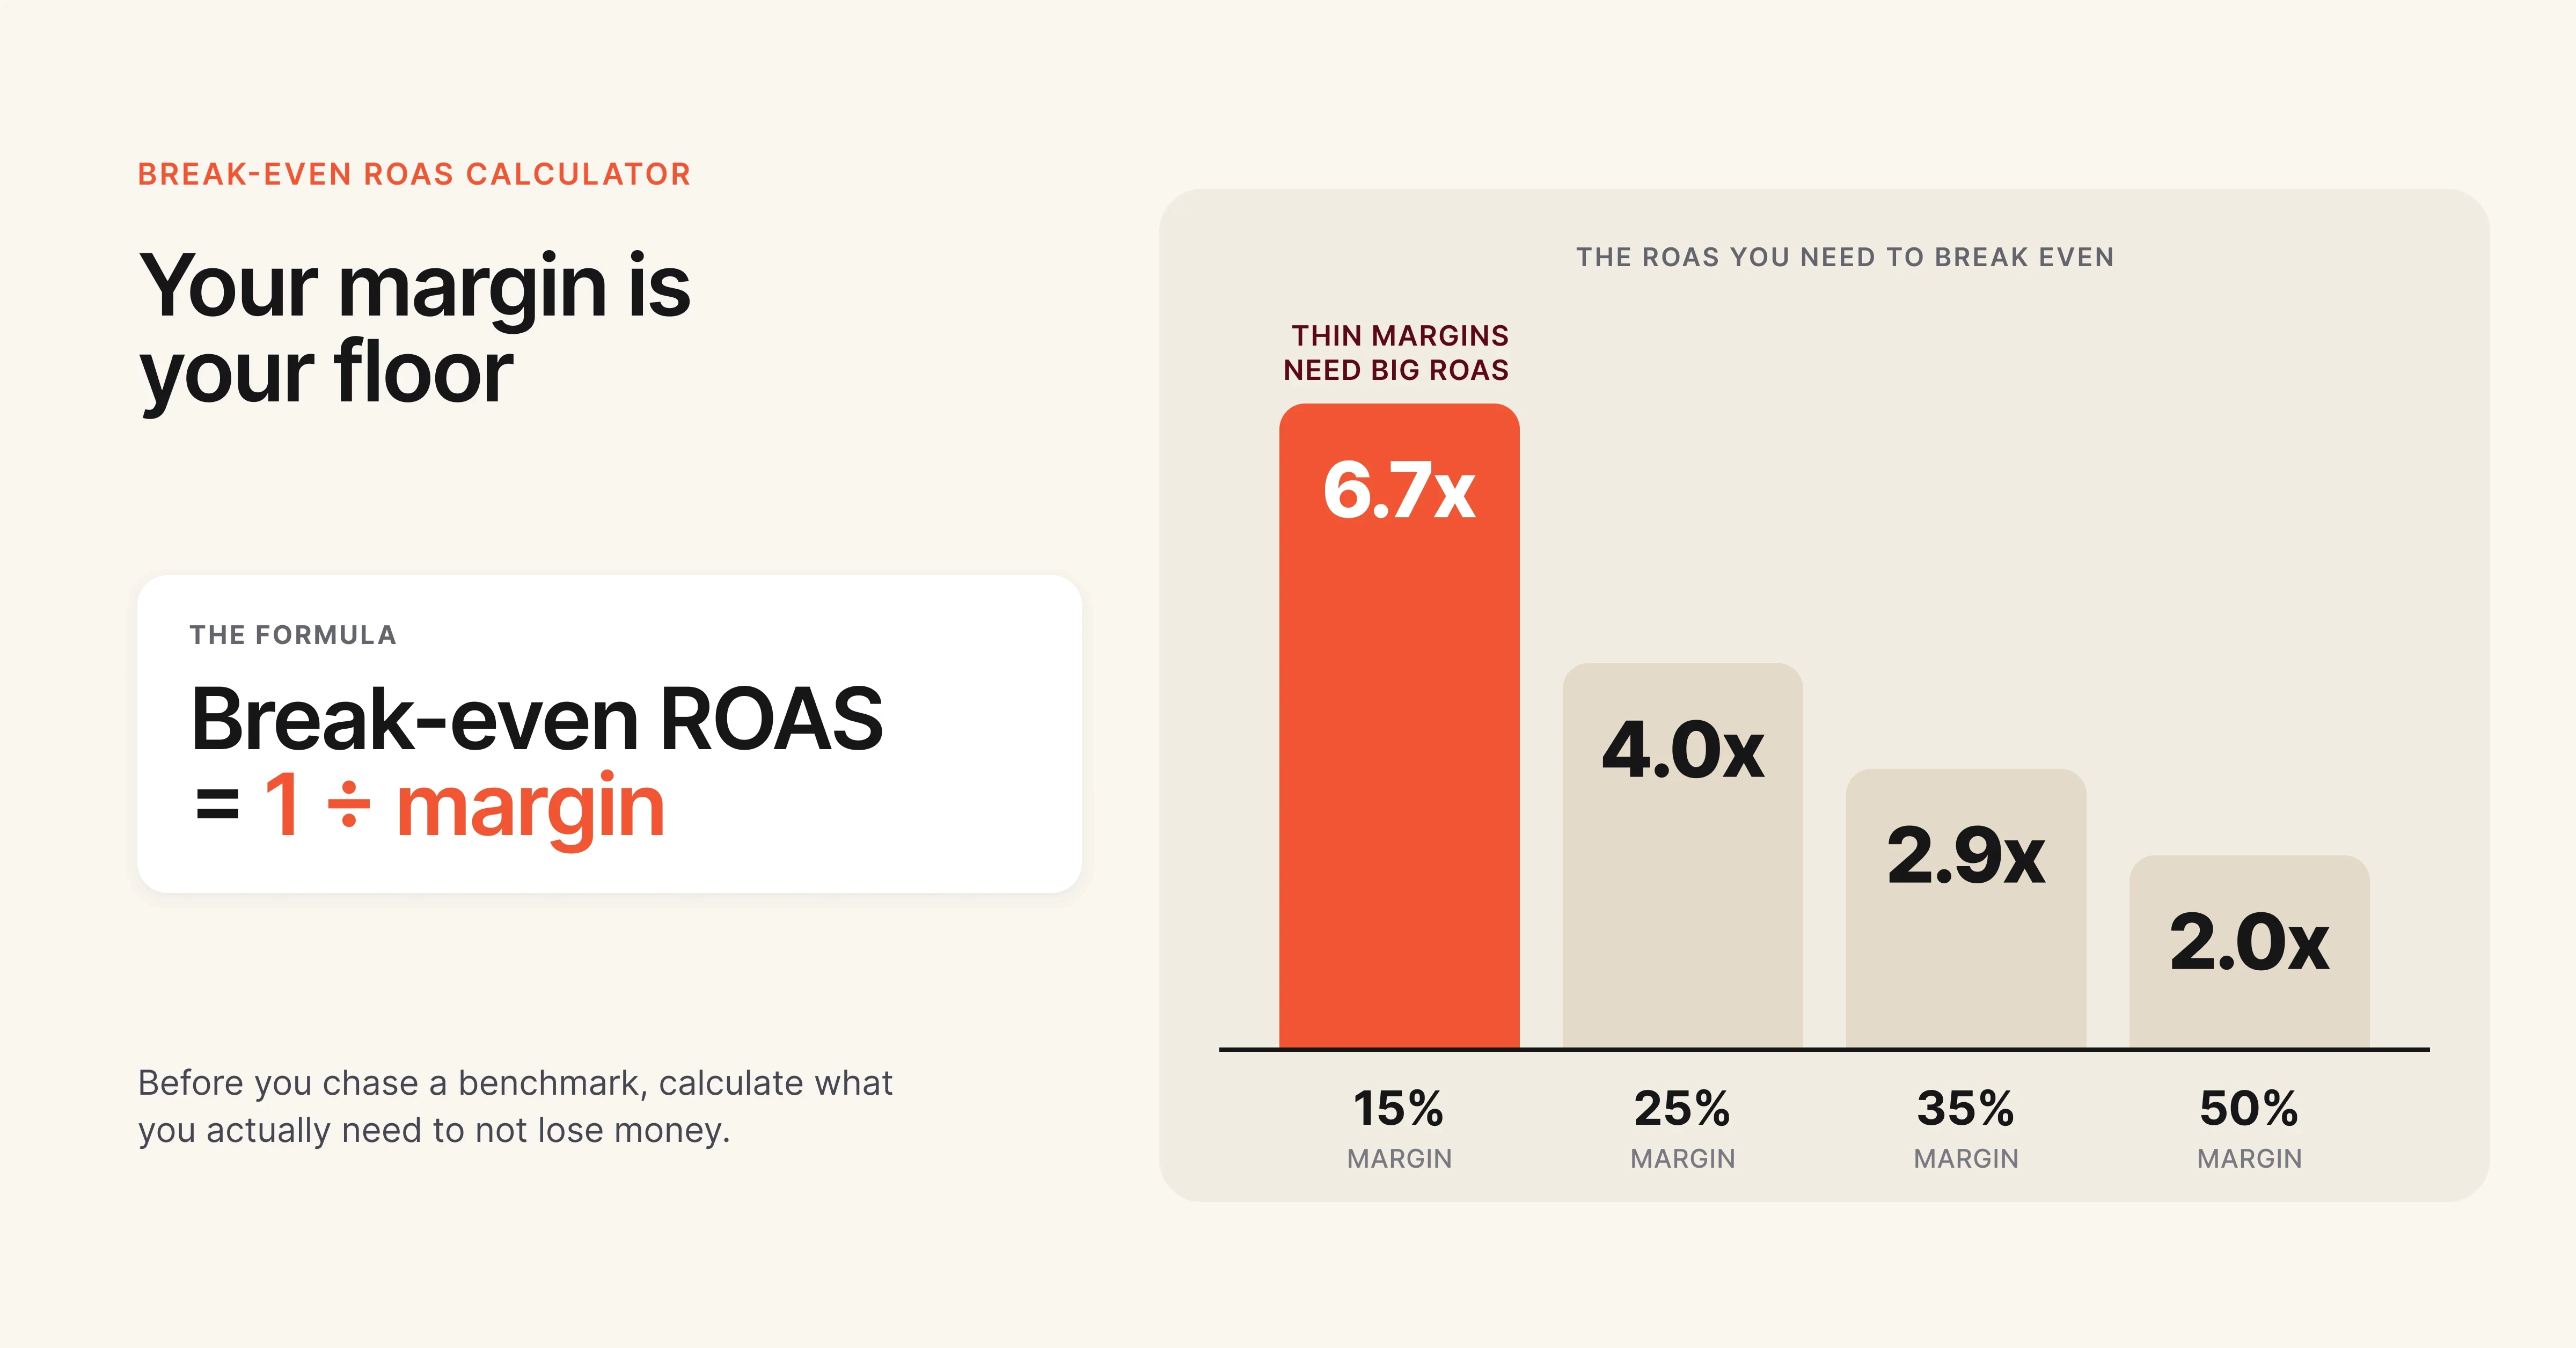
Break-Even ROAS = 1 / Net Profit Margin
If your net profit margin (after COGS, shipping, payment processing, and overhead) is 25%, your break-even ROAS is:
1 / 0.25 = 4.0x
That means you need $4 in revenue for every $1 in ad spend just to break even. Anything above 4.0x is profit from paid media.
| Net Profit Margin | Break-Even ROAS |
|---|---|
| 15% | 6.7x |
| 20% | 5.0x |
| 25% | 4.0x |
| 30% | 3.3x |
| 35% | 2.9x |
| 40% | 2.5x |
| 50% | 2.0x |
This table explains why "a good ROAS" is different for every business. A luxury brand with 50% margins is profitable at 2.0x ROAS. A consumer electronics brand with 15% margins needs 6.7x ROAS to break even. Same metric, completely different realities.
Three steps to find your number:
- Calculate your true net profit margin per order (revenue minus COGS, shipping, payment fees, returns, and allocated overhead)
- Divide 1 by that margin percentage to get your break-even ROAS
- Set your target ROAS 20-30% above break-even to build in a profit cushion
Once you know your break-even ROAS, industry benchmarks become context rather than targets. You stop chasing a number someone else published and start optimizing toward your actual profitability threshold.
For a deeper walkthrough on connecting ROAS to actual business outcomes, see Mastering Performance Marketing: Key Metrics and Tools and How to Find Your Winning Creative with Data.
Knowing your industry's ROAS benchmark is step one. Beating it requires specific changes to your creative strategy, targeting, and campaign structure. These seven tactics are what separates top-quartile performers from the median.
1. Fix Your Creative Before Touching Your Targeting
Creative is the single largest lever for ROAS improvement on Meta and TikTok. Ad platforms have shifted toward broad, algorithm-driven targeting (Advantage+ on Meta, Smart Bidding on Google). When the algorithm handles audience selection, the only variable you control at scale is the creative itself.
Teams that analyze performance at the element level (which hooks work, which CTAs convert, which visual styles hold attention) consistently outperform teams that test entire ads as monolithic units. Breaking creatives into components like hook, body copy, visual treatment, and CTA lets you identify what's actually driving results and recombine winning elements.
Platforms like Hawky specialize in this kind of element-level creative analysis, helping performance teams pinpoint exactly which creative components are lifting or dragging ROAS.
2. Separate New Customer and Retargeting ROAS Targets
Stop blending your ROAS across prospecting and retargeting campaigns. Set different targets for each. Retargeting campaigns will always show inflated ROAS because you're reaching people who already know your brand. Prospecting campaigns will show lower ROAS because you're paying to acquire new customers.
A healthy split: aim for 1.5-2.5x ROAS on prospecting and 5-10x on retargeting. Track both independently, and evaluate your media buyer on new customer acquisition cost, not blended ROAS.
3. Increase Average Order Value
Higher AOV improves ROAS without changing a single thing about your ad campaigns. If your average order goes from $50 to $75, your ROAS improves by 50% on the same ad spend.
Tactics that work: product bundles, volume discounts, free shipping thresholds set just above your current AOV, post-purchase upsells, and cross-sell recommendations on the cart page. Each of these increases revenue per conversion without increasing cost per click.
4. Build a Creative Refresh Calendar
Ad fatigue is the silent ROAS killer. High-spend accounts on Meta typically see creative performance degrade after 2-3 weeks. If you're running the same ads for a month or more, your ROAS decline probably isn't a targeting problem. It's a creative problem.
Build a calendar: refresh 25-30% of your creative assets every two weeks. Use performance data to identify which ads are hitting creative fatigue (declining CTR, rising CPM, falling conversion rate) and replace them with new variations built from your winning patterns. Running structured A/B testing on new creative variants against your controls accelerates this cycle and reduces guesswork.
5. Optimize Your Landing Pages for Conversion Rate
A 1% improvement in landing page conversion rate can improve ROAS by 25-50%, depending on your current baseline. Yet most performance teams spend 90% of their optimization time inside the ad platform and 10% on the post-click experience.
Test page speed (every second of load time costs you conversions), headline-to-ad message match, social proof placement, and checkout friction. These changes compound. A landing page that converts at 4% instead of 3% means you need 25% fewer clicks to generate the same revenue.
6. Use Broad Targeting with Strong Creative
On Meta, Advantage+ Shopping campaigns with broad targeting often outperform interest-based or lookalike targeting in 2026. The algorithm has gotten significantly better at finding buyers when you give it room to work, but only if your creative is strong enough to filter the right audience.
Weak creative plus broad targeting equals wasted spend. Strong creative plus broad targeting lets Meta's algorithm find pockets of high-intent users that manual targeting would miss. The creative becomes your targeting.
7. Track Blended ROAS Across All Channels
Individual platform ROAS is useful for campaign optimization, but it doesn't tell you whether your overall marketing spend is profitable. Track blended ROAS (total revenue / total marketing spend across all channels) to get the full picture.
Blended ROAS = Total Revenue / Total Marketing Spend (all channels combined)
A brand might see 2.0x ROAS on Meta, 6.0x on Google Search, and 3.5x on email. Blended ROAS across those channels might be 3.8x, which is the number that actually maps to profitability. Evaluate channel additions and budget shifts based on their impact on blended ROAS, not siloed platform metrics.
Attribution gaps make this harder than it sounds. Meta and Google both claim credit for overlapping conversions, which inflates platform-level ROAS and makes your total look better than reality. For a deeper look at how Meta's attribution works, see How to Master Meta's New Attribution Model. Use a source-of-truth measurement (your ecommerce platform revenue, not ad platform reported revenue) as the numerator for blended ROAS calculations.
For a detailed comparison of the tools that help with ROAS tracking and creative optimization, check out 9 Best Ad Creative Analysis Tools in 2026.
Benchmarks make more sense when you see them applied to real scenarios. Here are three examples showing how ROAS benchmarks play out differently depending on business model and margin structure.
Example 1: DTC Skincare Brand
A DTC skincare brand with 65% gross margins and a $55 average order value runs Meta and Google Shopping ads. Their break-even ROAS is 1.5x (1 / 0.65). The industry benchmark for beauty and personal care is 4.2x.
This brand targets 3.0x on new customer acquisition and 7.0x on retargeting, knowing their subscription model (40% attach rate) means first-order ROAS understates actual customer value. They evaluate campaigns on 90-day LTV-to-CAC rather than first-touch ROAS alone.
Example 2: B2B SaaS Company
A B2B SaaS company with a $15,000 annual contract value runs Google Search and LinkedIn ads. Their break-even ROAS on first-month revenue is technically below 1.0x, which looks terrible in isolation. But a single closed deal generates $15,000+ in annual recurring revenue.
This team measures ROAS on a 6-month cohort basis, factoring in the full sales cycle from click to closed deal. Their effective ROAS, measured against actual contract values, is 5.2x. The lesson: for long-cycle, high-LTV businesses, standard ROAS windows are misleading.
Example 3: Ecommerce Fashion Brand
A fast-fashion ecommerce brand with 35% margins and a $40 AOV needs at least 2.9x ROAS to break even. The apparel benchmark is 4.3x, and this brand is hitting 3.2x blended.
They're profitable but underperforming the benchmark. Digging deeper reveals their prospecting campaigns run at 1.8x while retargeting hits 6.5x. The fix isn't to cut prospecting spend. It's to improve prospecting creative to close the gap.
They start analyzing which hooks and visual treatments work in cold audiences vs. warm audiences, and they test new formats (UGC-style video, creator partnerships) to improve cold traffic ROAS by targeting 2.5x. Within 6 weeks of running element-level creative analysis and refreshing underperformers, their prospecting ROAS climbs to 2.4x and blended ROAS reaches 3.9x. The benchmark didn't change. Their approach to creative did.
A good ROAS in 2026 is any number above your break-even ROAS, which depends on your profit margins. The commonly cited benchmark is 3:1 (3.0x), meaning $3 in revenue per $1 in ad spend. For most ecommerce businesses with 25-35% margins, a ROAS between 3.0x and 5.0x represents solid, profitable performance. High-margin businesses can be profitable at 2.0x, while low-margin businesses may need 5.0x or higher.
Is a 3x ROAS good?
A 3x ROAS is good for businesses with profit margins of 35% or higher, where break-even ROAS is approximately 2.9x. For businesses with margins below 30%, a 3x ROAS may only cover costs without generating meaningful profit. Always compare your ROAS against your calculated break-even point rather than relying on a universal benchmark.
What is the average ROAS for ecommerce?
The average ROAS for general ecommerce is approximately 4.0:1 on Google Ads and 2.5-4.0x on Meta Ads in 2026. The average across Shopify stores is between 2.5x and 3.8x. Ecommerce ROAS dropped 4% year-over-year in 2025, reaching 2.87x, driven by rising CPMs and increased competition. Performance varies significantly by sub-niche, platform, and whether you measure new customer or blended ROAS.
What ROAS should I aim for on Meta (Facebook) ads?
For Meta Ads, aim for 2.5x to 4.0x ROAS as a starting benchmark. Impulse-purchase categories like apparel and beauty should target 3.0x or higher, while higher-ticket items like furniture or electronics typically see 1.8x to 2.5x. Retargeting campaigns on Meta often deliver 5.0x to 10.0x.
Your specific target should be based on your break-even ROAS calculation, not a generic benchmark.
What is the difference between ROAS and ROI?
ROAS measures revenue generated per dollar of ad spend (Revenue / Ad Spend), while ROI measures profit relative to total investment ((Profit - Total Cost) / Total Cost). A campaign can show a strong ROAS of 4.0x while delivering a low ROI of 10-20% once you deduct product costs, shipping, fees, and overhead. ROAS is useful for comparing campaign efficiency; ROI tells you whether the business actually made money.
How do I improve my ROAS quickly?
The fastest ways to improve ROAS are: refresh fatigued ad creatives (the most common cause of ROAS decline), increase average order value through bundles and upsells, improve landing page conversion rates, and separate new customer and retargeting campaigns to optimize each independently. Creative refresh alone can recover 15-30% of lost ROAS within two weeks for high-spend accounts experiencing ad fatigue.
ROAS benchmarks give you a baseline, but they're starting points, not finish lines. The brands that consistently beat their industry's average do three things: they know their break-even ROAS to the decimal, they treat creative as a performance lever (not just a design deliverable), and they track new customer and repeat customer ROAS separately.
If your team is spending hours in spreadsheets trying to figure out which creative elements are driving ROAS, Hawky's creative intelligence platform automates that analysis at the element level, from hooks to CTAs to visual treatments, so you can make faster, data-backed creative decisions.
If you need element-level creative analysis that connects directly to ROAS, CPL, and CTR outcomes, Hawky's Creative Analysis is built for that job.