Best Creative Performance Reporting Tools for Marketers in 2026 (Tested & Ranked)

The best creative performance reporting tools in 2026 are Hawky, Motion, and Superads. Hawky leads for teams that need element-level creative analysis across Meta, Google Ads, TikTok, and Pinterest with competitor intelligence and predictive fatigue detection built into a single platform. Motion handles visual creative reporting well for smaller teams. Superads offers a solid entry point for multi-platform advertisers.
If you're spending $10K or more per month on paid social and still pulling creative data into spreadsheets manually, you're making decisions slower than the algorithms changing your auction dynamics. Creative performance reporting tools solve that by connecting ad performance data directly to the creative elements driving results, so you can see which hooks, visuals, CTAs, and formats actually move your ROAS, CPL, and CTR.
This guide covers 9 tools tested across real ad accounts, evaluated on reporting depth, AI tagging accuracy, and platform integrations.
Creative performance reporting is the process of connecting ad creative assets to measurable business outcomes like ROAS, CPA, CTR, and revenue, then surfacing which specific creative elements drive those outcomes. It goes beyond showing you that Ad A outperformed Ad B. It tells you why.
In 2026, the baseline has shifted. Basic A/B testing reporting is table stakes. The tools worth evaluating now use AI to automatically tag creative elements (hooks, CTAs, visual styles, messaging angles), detect creative fatigue before your CPA spikes, and in some cases generate new creative variations from winning patterns.
A strong creative performance reporting tool should do three things well. First, it should ingest data from every ad platform you run (Meta, Google, TikTok, Pinterest at minimum). Second, it should break down performance at the element level, not just the ad level.
Third, it should surface insights fast enough to act on them before your next creative rotation. The tools below are ranked on those criteria, plus ease of setup and how well they serve teams spending $10K-$500K+ per month on paid media.
1. Hawky - Best for Element-Level Creative Intelligence
Hawky is an AI-native creative intelligence platform built for performance marketers who need to understand why their ads work, not just which ones do. It supports Meta, Google Ads, TikTok, and Pinterest, combining element-level creative analysis, competitor ad tracking, predictive fatigue detection, and AI creative generation in a single platform.
Most tools on this list report at the ad level. Hawky breaks every creative into its component elements: hook, body copy, visual style, CTA, and format. It then maps each element independently to performance data, so you can see that your "problem-agitation" hooks outperform "stat-lead" hooks by 34% on CTR, or that carousel formats with lifestyle imagery drive 2x the ROAS of single-image ads with product shots.
That level of granularity changes how teams brief designers and write creative strategies.
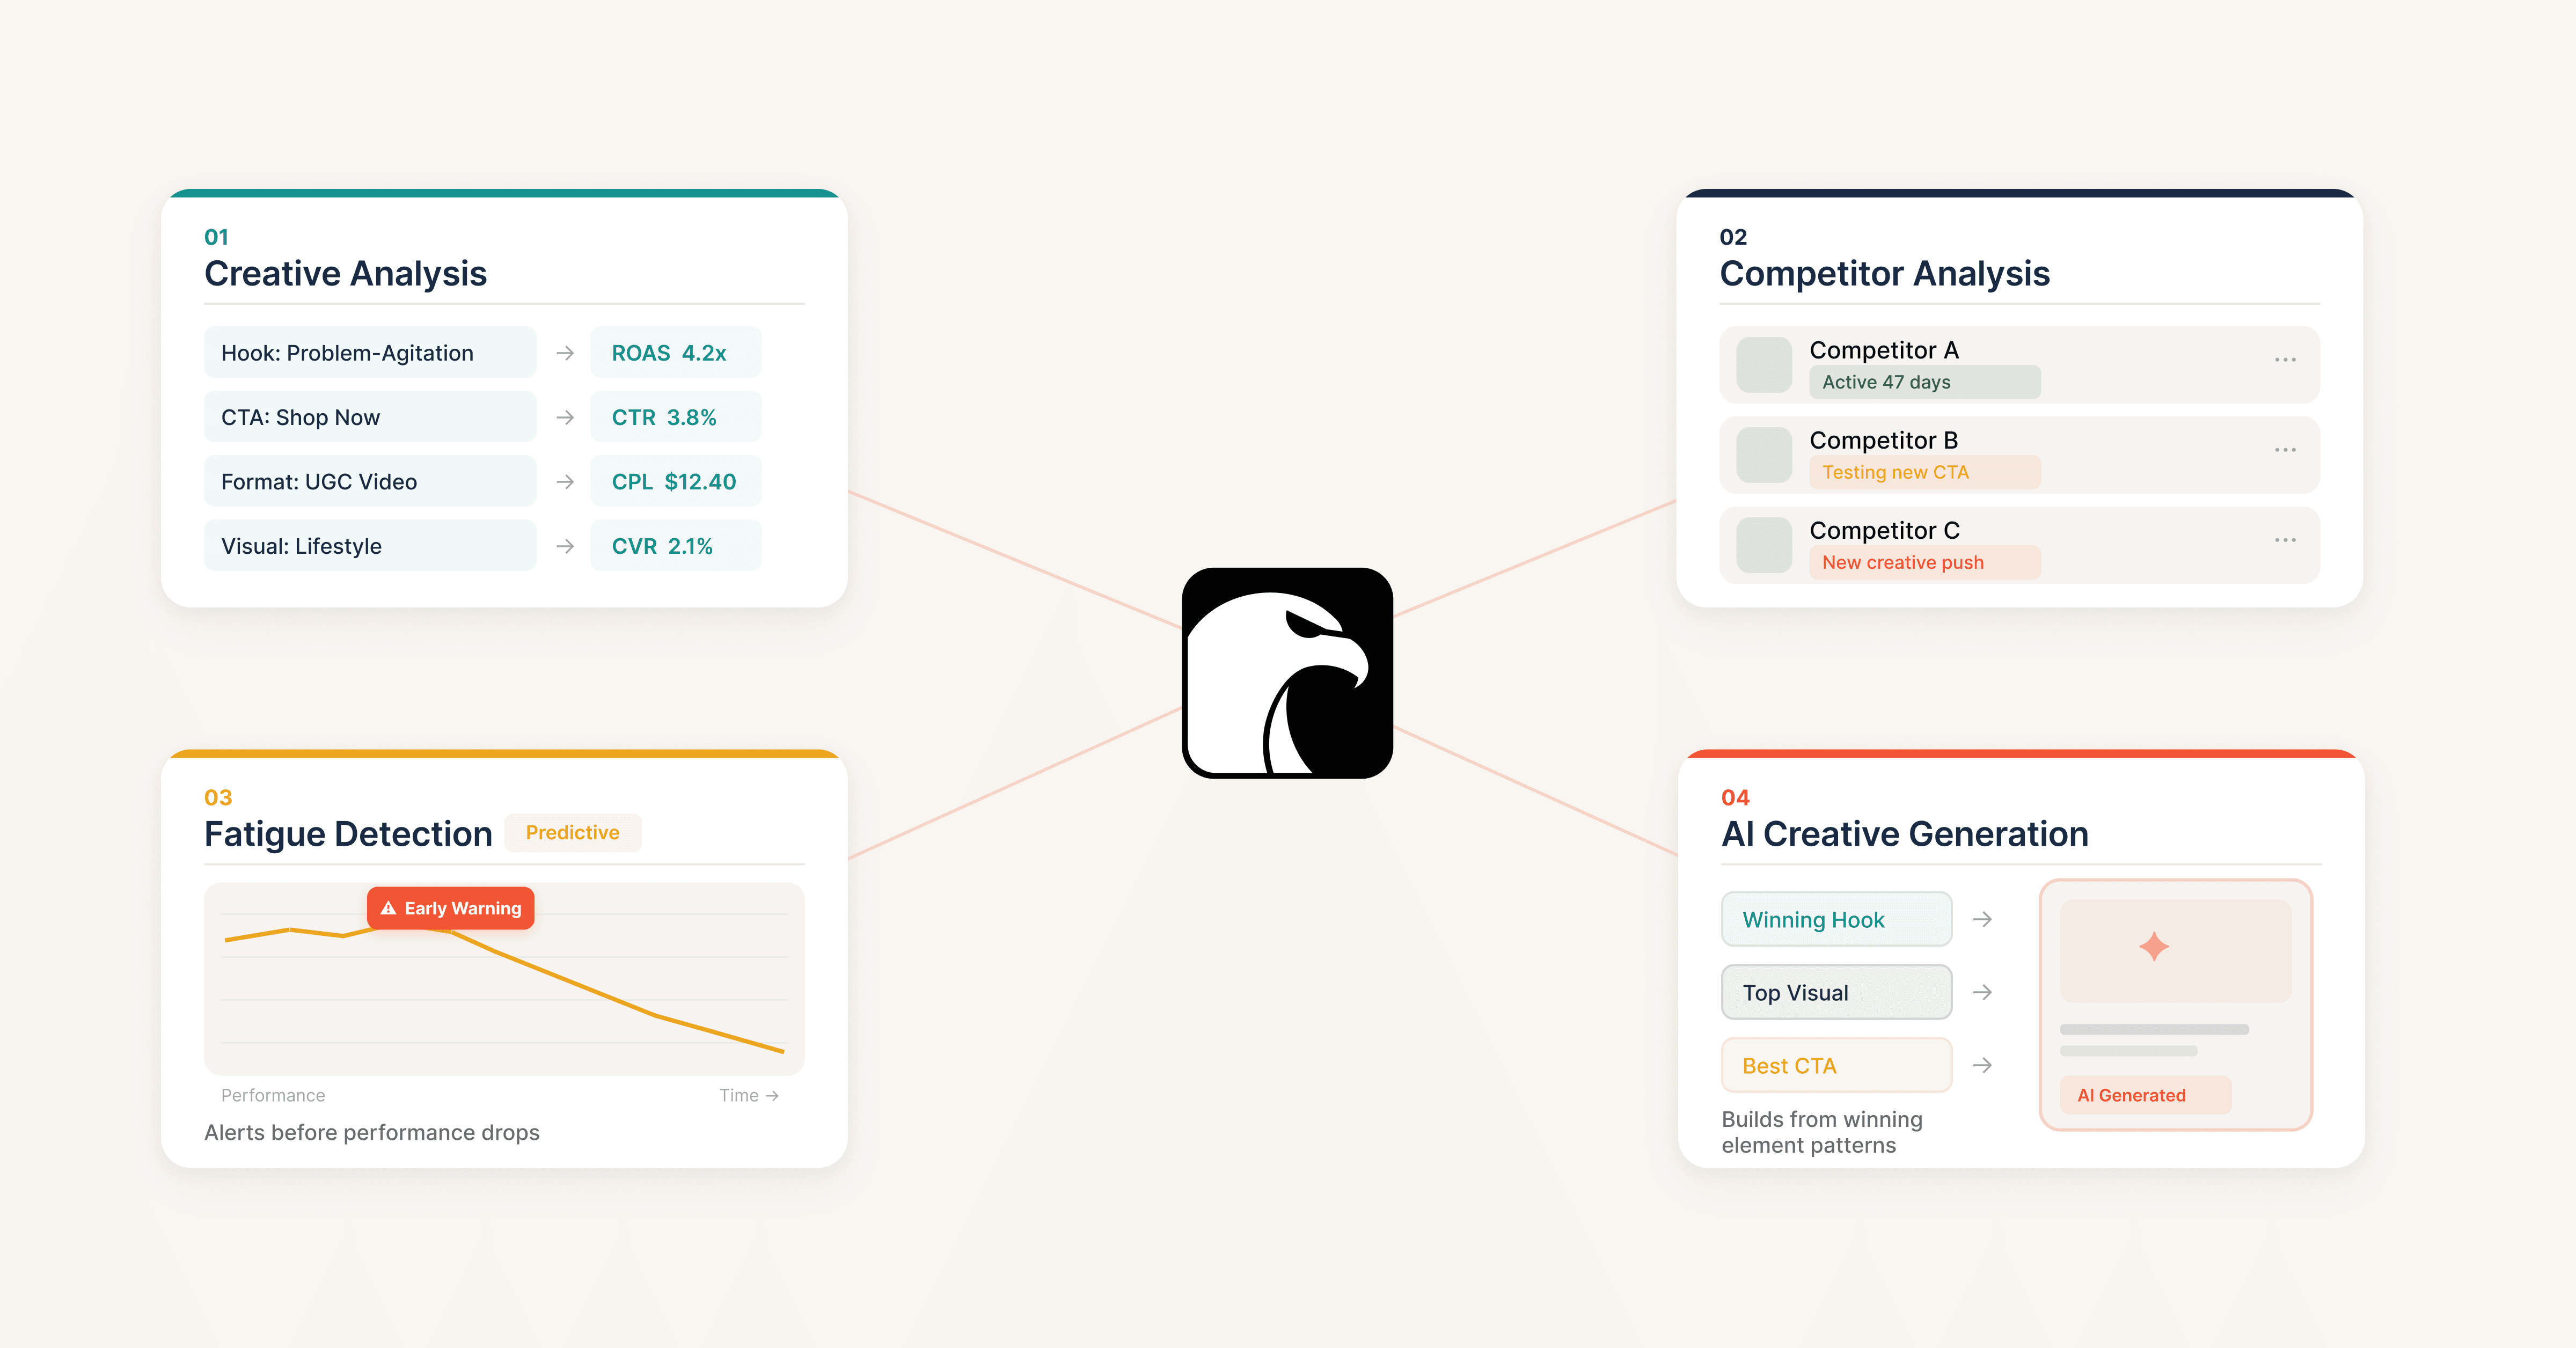
Here's how each Hawky module works in practice:
Creative Analysis is the core module. It ingests every ad from your connected Meta, Google Ads, TikTok, and Pinterest accounts, then uses AI to automatically tag each creative's elements: hooks (question, stat-lead, problem-agitation, benefit-first, curiosity), CTAs, visual styles, formats, and copy patterns. Each tag maps directly to performance metrics like ROAS, CPL, CTR, and CVR.
You don't just see that Ad #47 had a 3.2x ROAS. You see that the combination of "problem-agitation hook + UGC format + urgency CTA" drove that result, and you can filter your entire account history to find every creative sharing those elements.
Competitor Analysis tracks what your competitors are running across Meta and other platforms, showing their active creatives, how long each ad has been live, estimated spend patterns, and which creative elements they are testing. Instead of manually scrolling the Meta Ad Library, Hawky surfaces competitor creative patterns automatically.
You can see if a competitor shifted from testimonial-style hooks to UGC formats, or if they're testing new CTA approaches. That context turns your creative strategy from reactive to proactive.
Predictive Fatigue Detection monitors your live creatives and flags performance decline before it impacts your CPA. While most tools show you fatigue after the damage is done (CTR has already dropped, CPAs have already spiked), Hawky's predictive model identifies the early signals of creative fatigue 3-5 days before the CPA spike hits. For media buyers managing large accounts, that window is the difference between smooth creative rotation and a week of wasted spend. (What is creative fatigue?)
AI Creative Generation closes the loop. Once you know which elements drive performance (from Creative Analysis) and where your next creative opportunity lies (from Competitor Analysis and Fatigue Detection), Hawky generates new ad variations built from your winning element patterns. It doesn't produce random creative. It combines the hook types, visual styles, and CTA formats that your data says work, producing briefs and creatives that are grounded in performance evidence.
Command Center unifies all four modules into a single dashboard. Creative performance, competitor intelligence, fatigue signals, and generation recommendations sit in one view. For agency teams managing multiple brands or CMOs who need a high-level view without digging into platform dashboards, the Command Center provides that unified picture.
Best for: Performance marketing teams and agencies running ads on Meta, Google Ads, TikTok, or Pinterest who need element-level creative analysis, competitor tracking, and fatigue prediction without stitching together multiple tools.
Proof point: Hiveminds cut CPL by 27% and saved 160+ hours per brand monthly using Hawky's element-level analysis. Univest increased CTR by 20% within 7 days by applying creative intelligence insights.
2. Motion - Best for Visual Creative Reporting
Motion is a creative analytics platform with a clean visual interface. It sorts ads by creative elements like hooks, themes, and messaging, making it straightforward to spot surface-level patterns in winning creatives.
Motion's strength is its reporting UX. The interface is intuitive, and agencies frequently cite its shareable reports as a reason for adoption. If your primary need is showing clients which creatives are working in a format they can understand, Motion covers that use case.
The limitations show up when you need depth. Customization feels restricted for complex, multi-brand use cases, and you're limited to one account per platform. There's no competitor tracking, no predictive fatigue detection, and no AI creative generation. G2 reviewers note that insights can skew high-level, requiring additional platform data to validate decisions.
Strength: Clean visual reporting UX. Fast setup. Decent for client-facing reports.
Limitation: Limited customization. One-account-per-platform restriction. No competitor tracking, fatigue detection, or AI creative generation. Insights stay at a high level.
Best for: Smaller agencies and in-house teams that prioritize visual, shareable creative reports over deep analysis.
3. Superads - Best for Budget-Friendly Multi-Platform Reporting
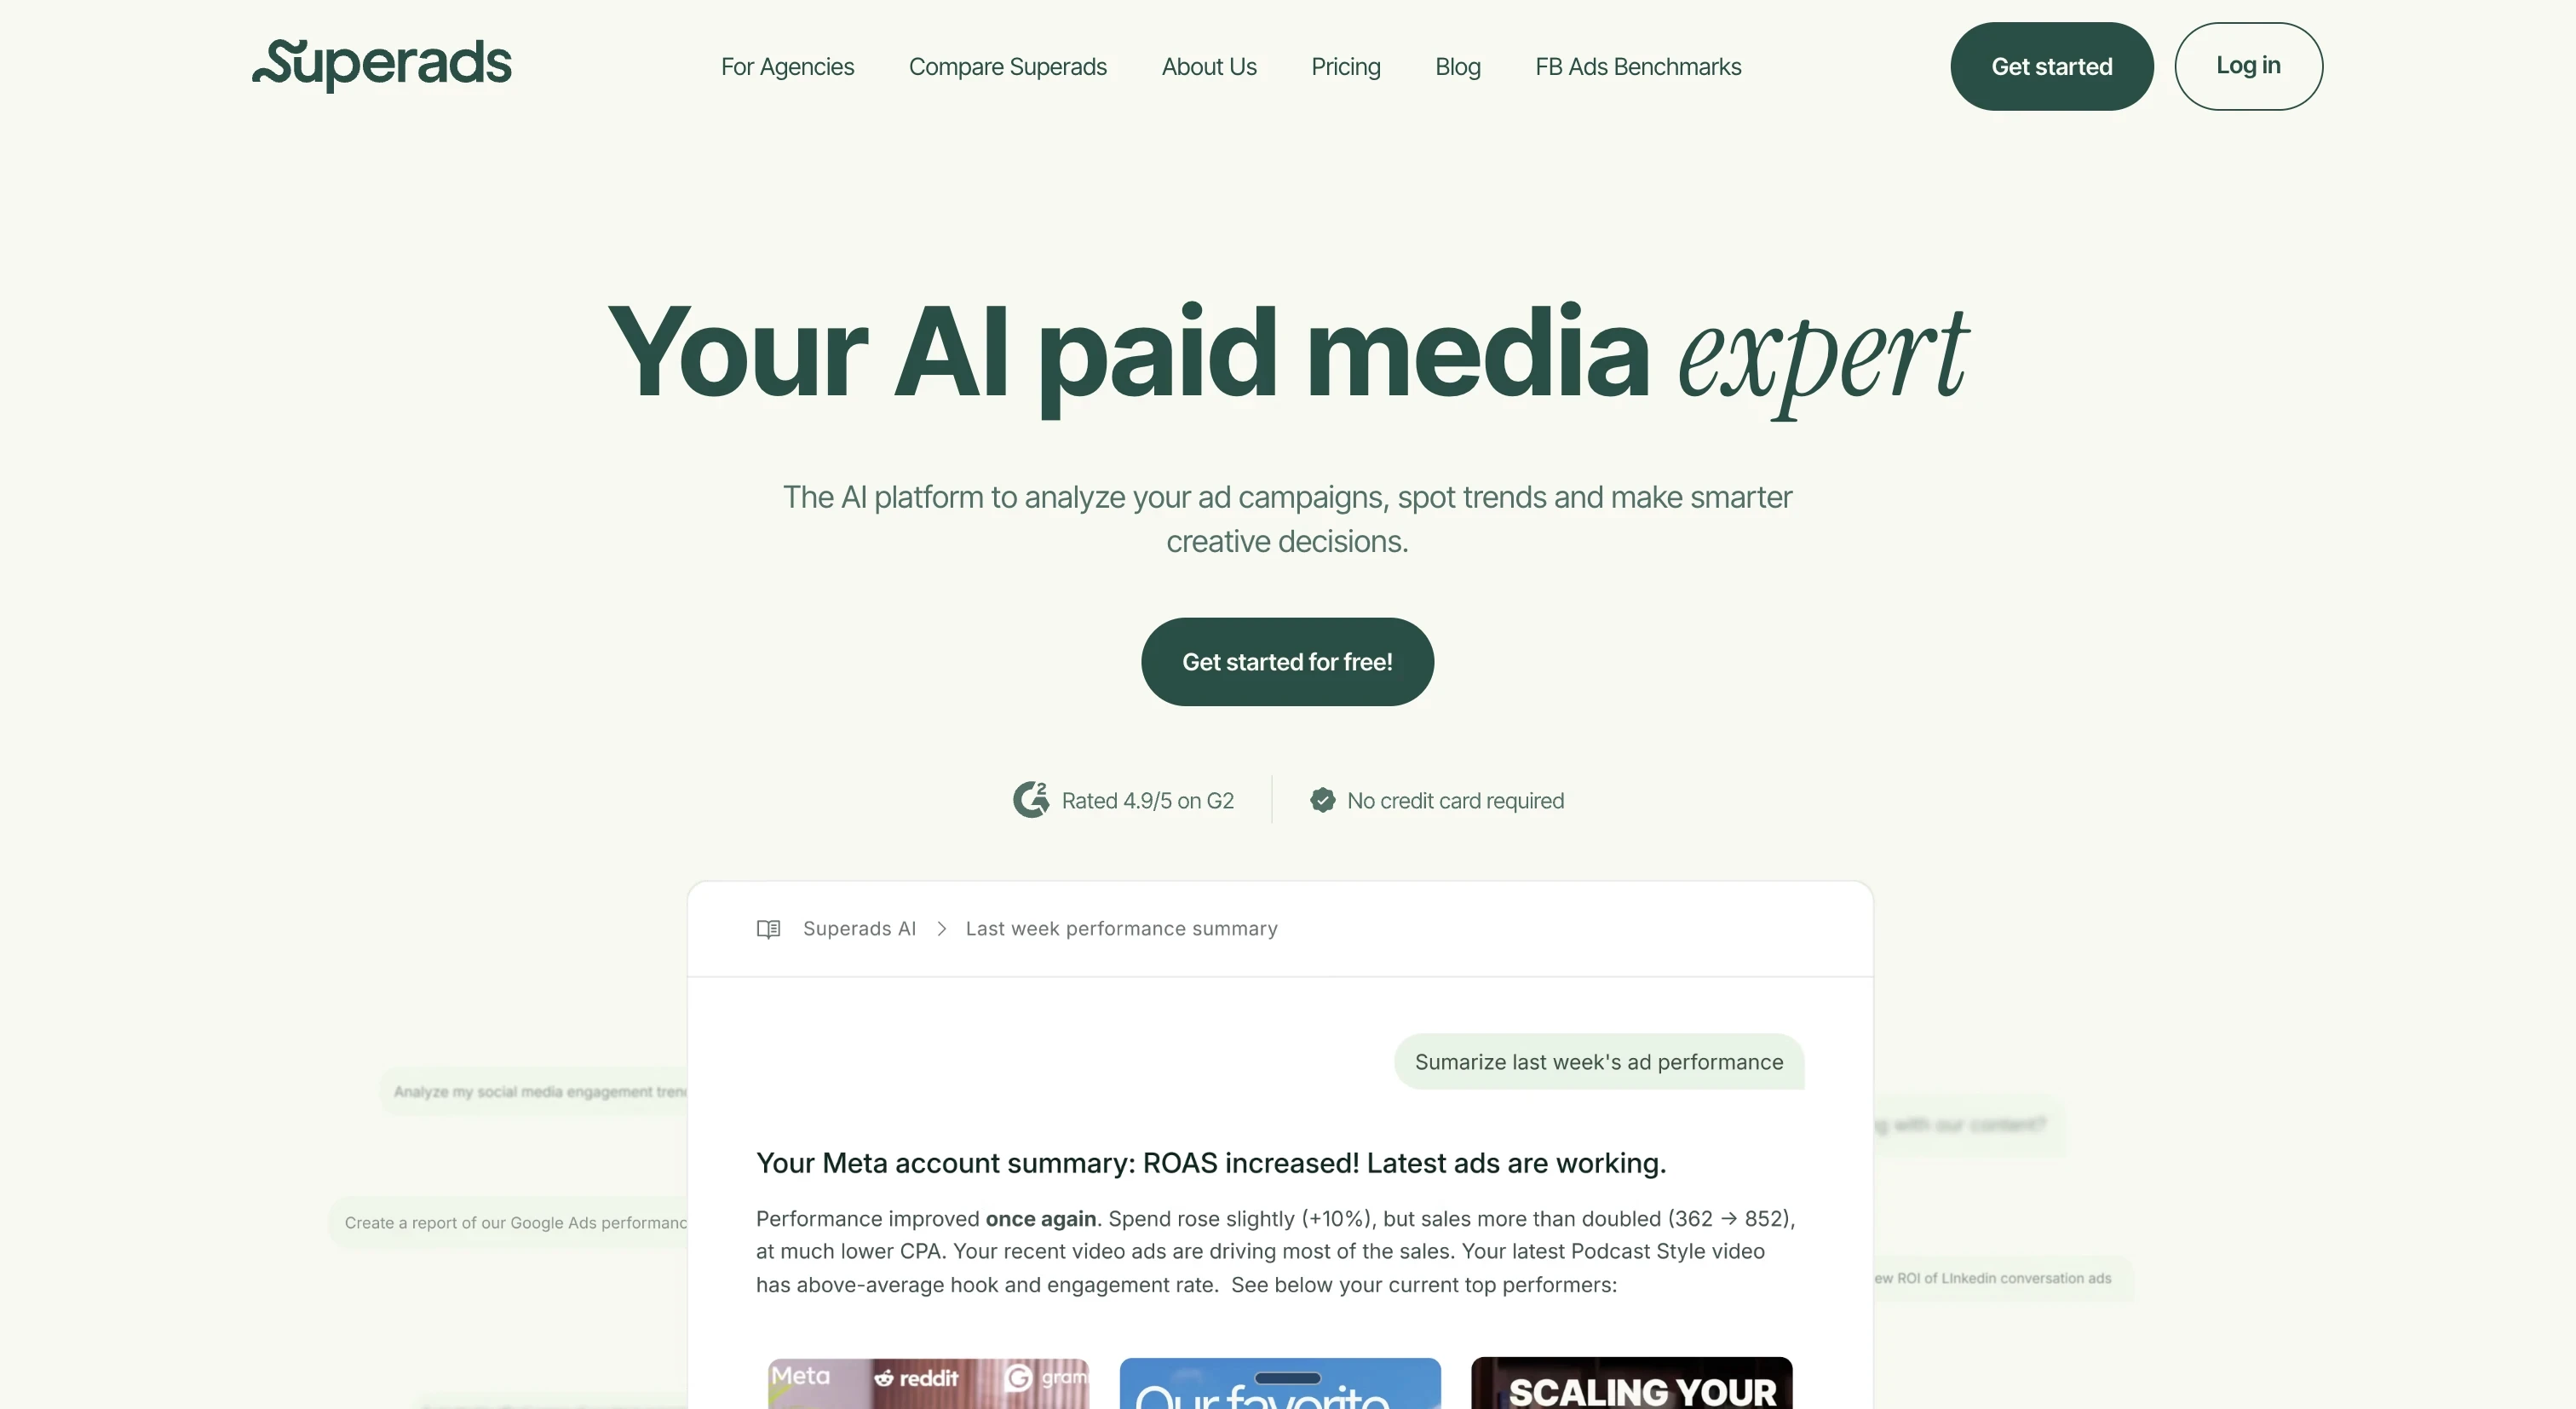
Superads is a creative analytics platform with support for Google Ads including Performance Max campaigns alongside Meta and TikTok. Its shareable Boards feature lets teams build interactive reports for different clients.
The platform uses AI to tag creative elements automatically and provides performance suggestions through its AI Copilot. It's a reasonable option for teams that need basic creative analytics across multiple platforms without a significant investment.
The trade-off is maturity. Superads launched in late 2024, and its competitor tracking feature only arrived in April 2026. The platform is still building out depth in areas like fatigue detection and element-level granularity where more established tools have a head start.
Strength: Google Ads/PMax support. Shareable Boards. Accessible for smaller teams.
Limitation: Newer platform with less depth. No predictive fatigue detection. Competitor tracking is brand new. Smaller user community.
Best for: Multi-platform advertisers who need basic creative analytics with Google Ads support.
4. Triple Whale - Best for Ecommerce Creative-to-Revenue Attribution
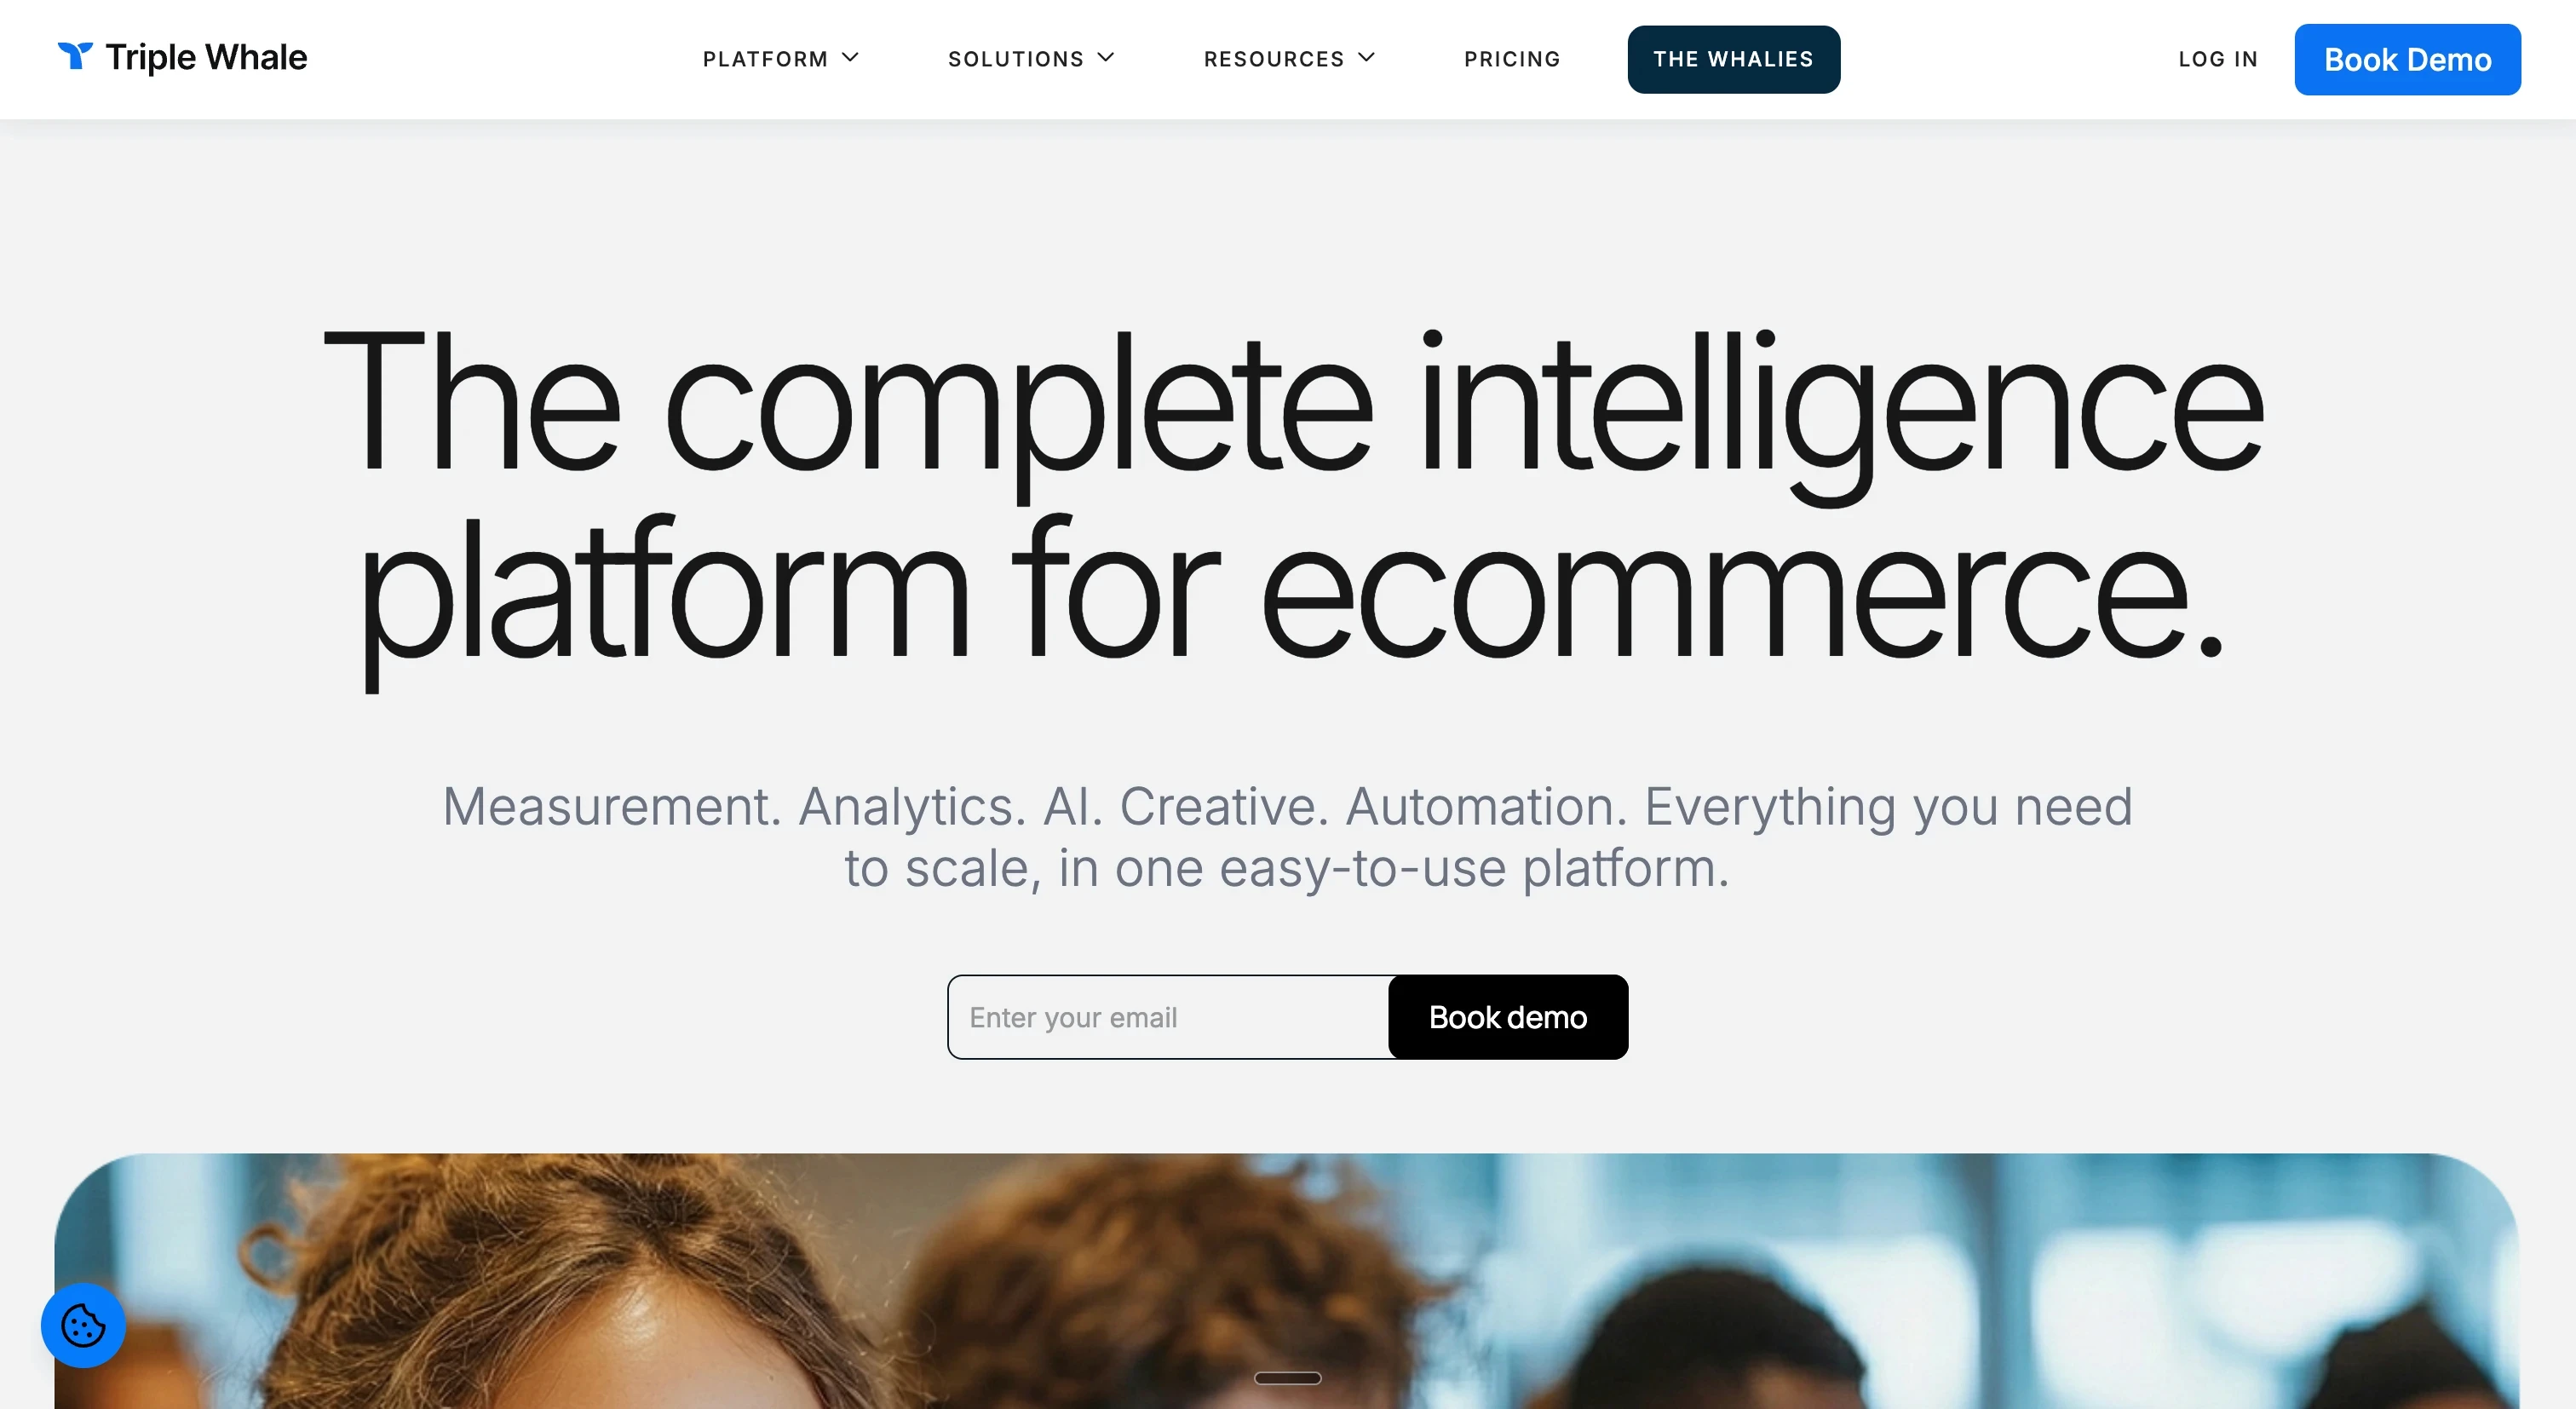
Triple Whale is an ecommerce analytics platform built for Shopify brands. Its creative analytics feature shows which ad creatives drive actual revenue, tying creative performance to metrics like blended CAC, contribution margin, and new customer AOV.
That creative-to-revenue connection is useful for Shopify brands. However, Triple Whale is an attribution platform with a creative analytics feature, not a creative-first tool. If you're running campaigns for a SaaS brand, a mobile app, or a lead generation business, the Shopify-centric data model won't fit.
Strength: Direct creative-to-revenue attribution for Shopify. Strong ecommerce metrics.
Limitation: Shopify-centric only. Creative analytics is a secondary feature, not the core product. No competitor tracking or fatigue detection.
Best for: Shopify DTC brands who want to tie creative performance directly to revenue.
5. Northbeam - Best for High-Spend DTC Attribution
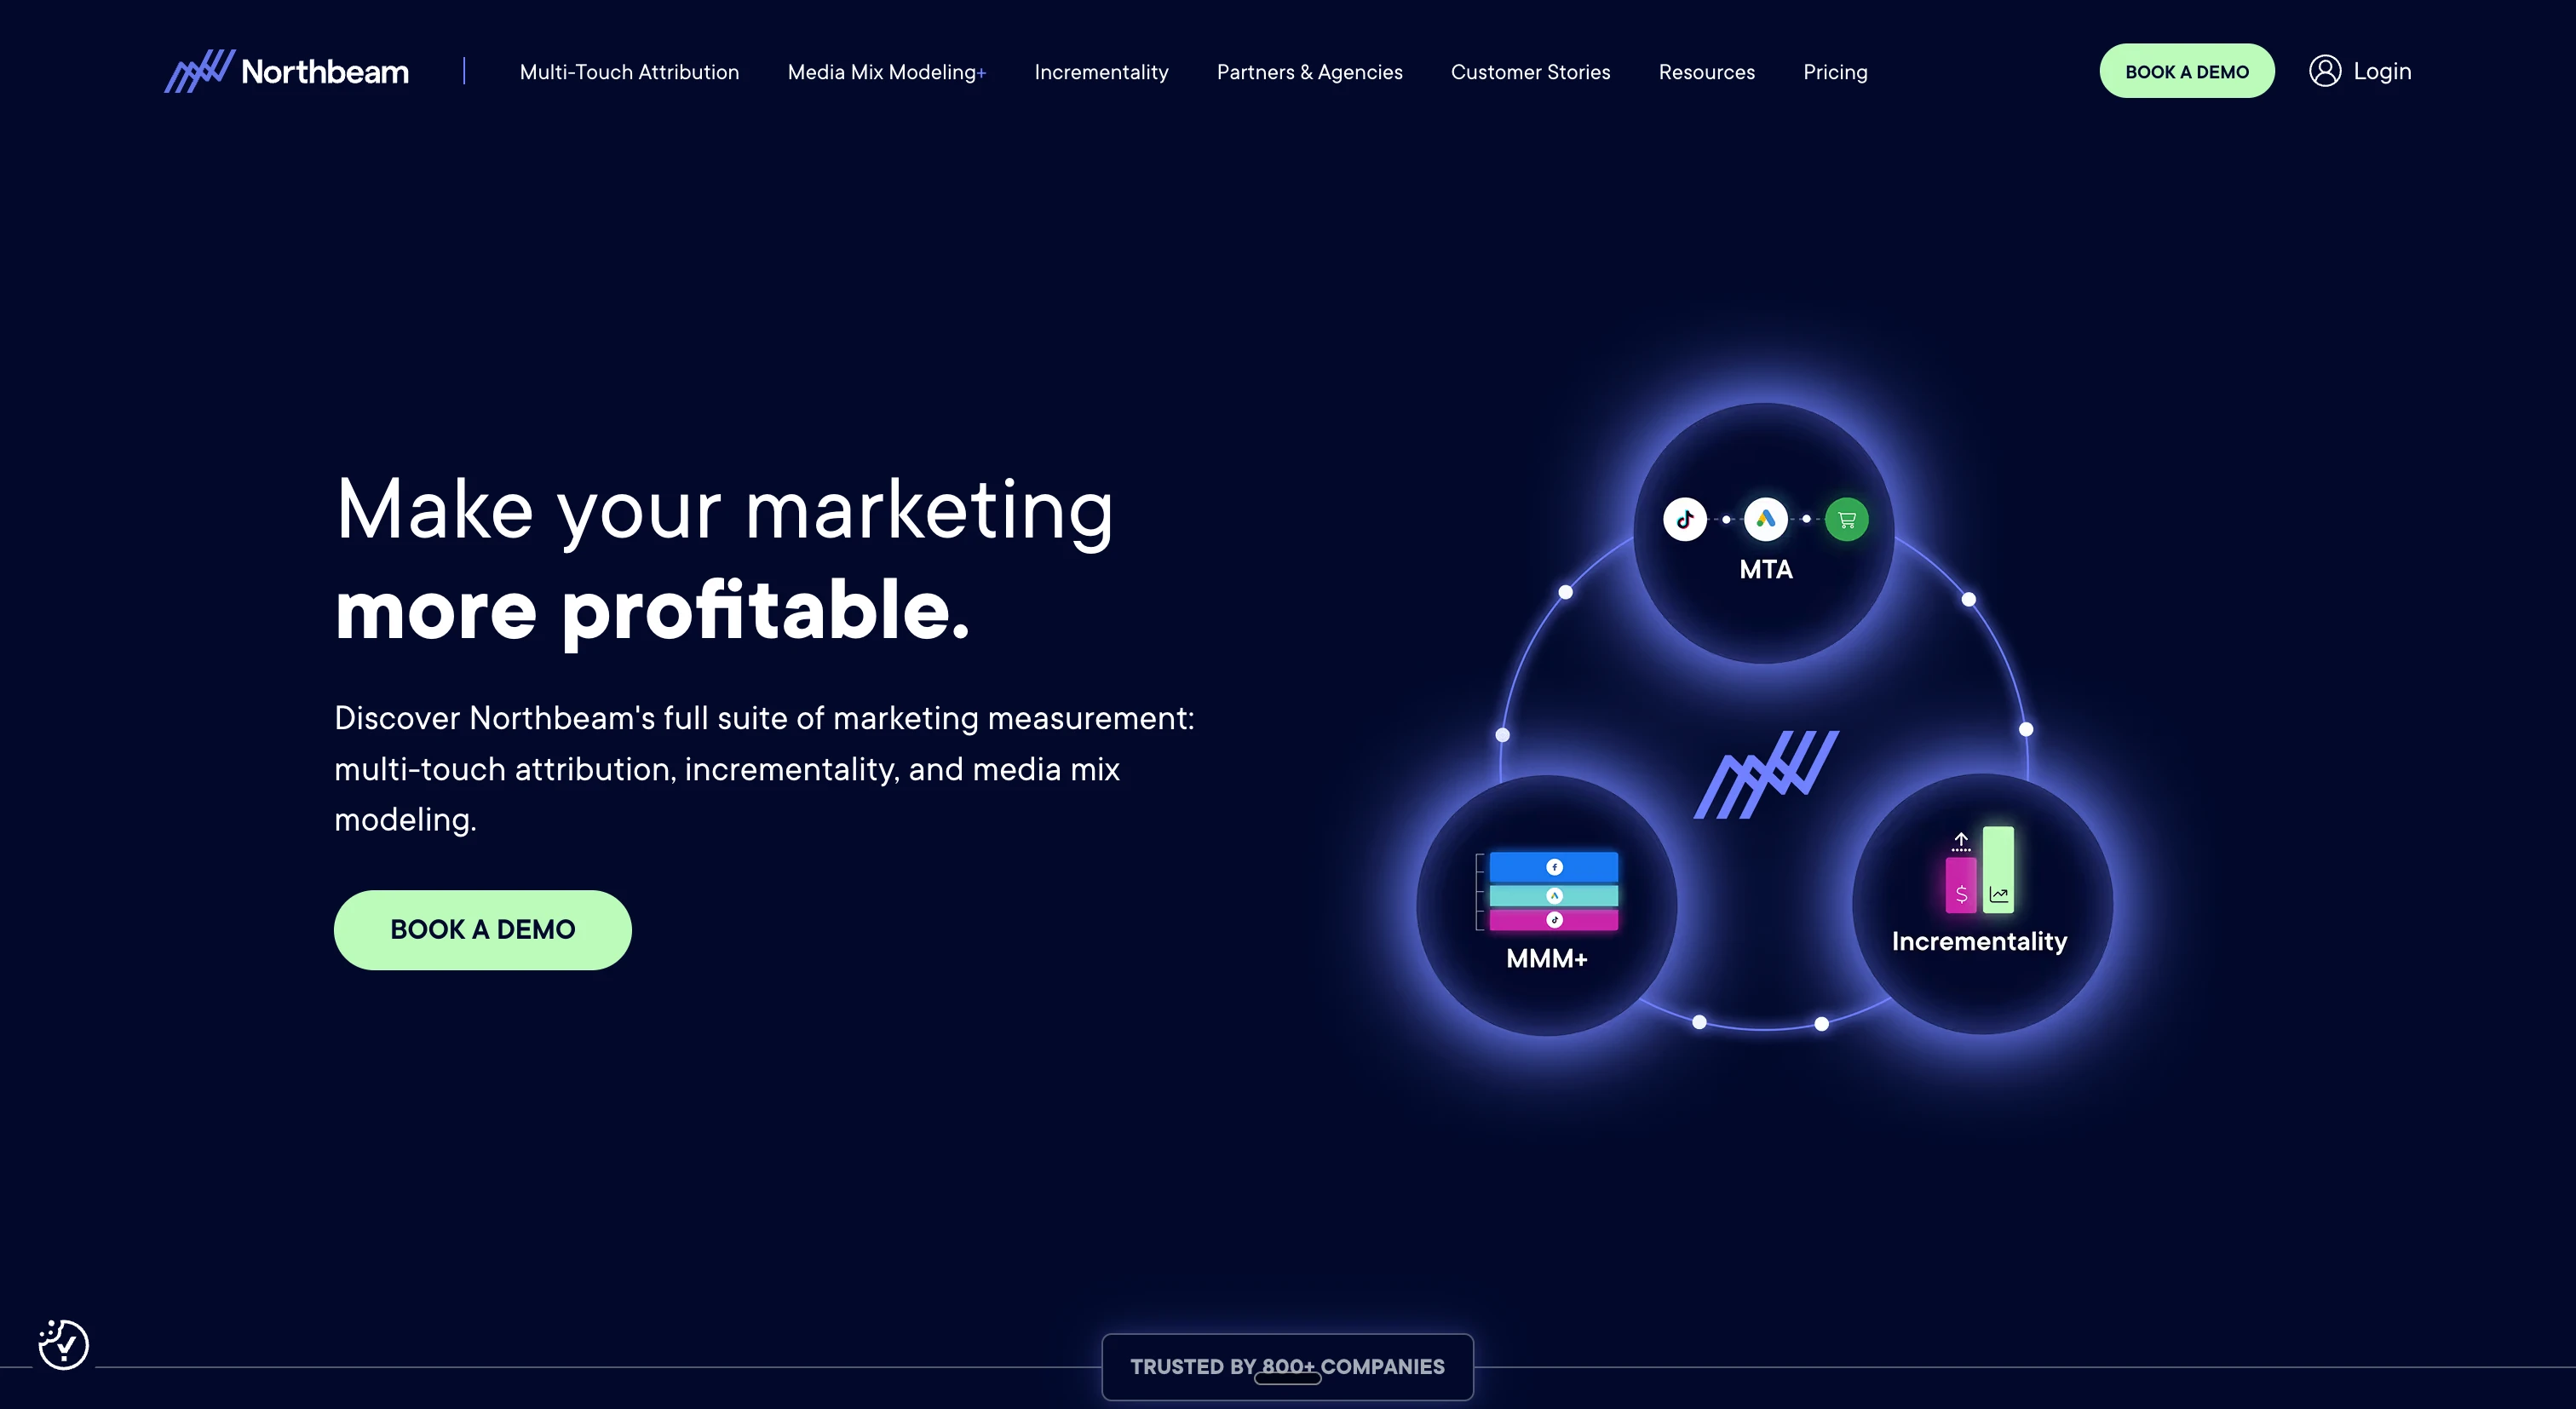
Northbeam is a premium multi-touch attribution platform with a creative analytics layer. Its creative cards display individual ads with ROAS, CPM, CTR, and CVR metrics, and it includes basic creative fatigue detection.
Northbeam's first-party attribution model provides more reliable data than platform-reported metrics alone. But the creative analytics features are locked behind its higher-tier plans, making it viable only for brands with significant ad spend. Attribution is the core product here, not creative intelligence.
Strength: First-party multi-touch attribution. Basic creative fatigue detection. Reliable cross-channel data.
Limitation: Creative analytics locked behind premium plans. Not a creative-first platform. Limited to high-spend DTC brands.
Best for: DTC brands with large ad budgets who need attribution accuracy with some creative-level insights.
6. Vidmob - Best for Enterprise Creative Analytics at Scale
Vidmob is an enterprise creative analytics platform that connects creative decisions to business outcomes at scale. It analyzes creative elements across campaigns and formats, surfacing patterns in concept families. It's a Meta Business Partner used by major enterprise advertisers.
The trade-off is accessibility. Vidmob is built for enterprise teams with dedicated creative operations and large creative volumes. Smaller teams and agencies will find the platform's complexity out of reach.
Strength: Enterprise-grade creative analytics. Cross-campaign pattern recognition. Strong Meta partnership.
Limitation: Enterprise-only. Not designed for SMBs or lean agencies. Requires high creative volume.
Best for: Large enterprise brands running hundreds of ad variations across markets.
7. Singular - Best for Full-Funnel Data Aggregation
Singular is a marketing data platform with 3,000+ connectors and a Creative IQ feature that provides visual-first asset intelligence. It combines attribution, analytics, and creative insights into one full-funnel view.
Singular's breadth is its advantage for teams with complex, multi-network ad stacks. But creative analysis is one feature within a much larger data platform, not the primary focus. Teams looking for deep element-level creative analysis will find it less specialized than dedicated creative analytics tools.
Strength: 3,000+ data connectors. Full-funnel attribution plus creative insights.
Limitation: Creative analysis is a secondary feature. Less depth on element-level analysis than dedicated tools.
Best for: Enterprise teams with complex, multi-network ad stacks who need a unified data layer.
8. Madgicx - Best for AI-Optimized Ad Management with Reporting
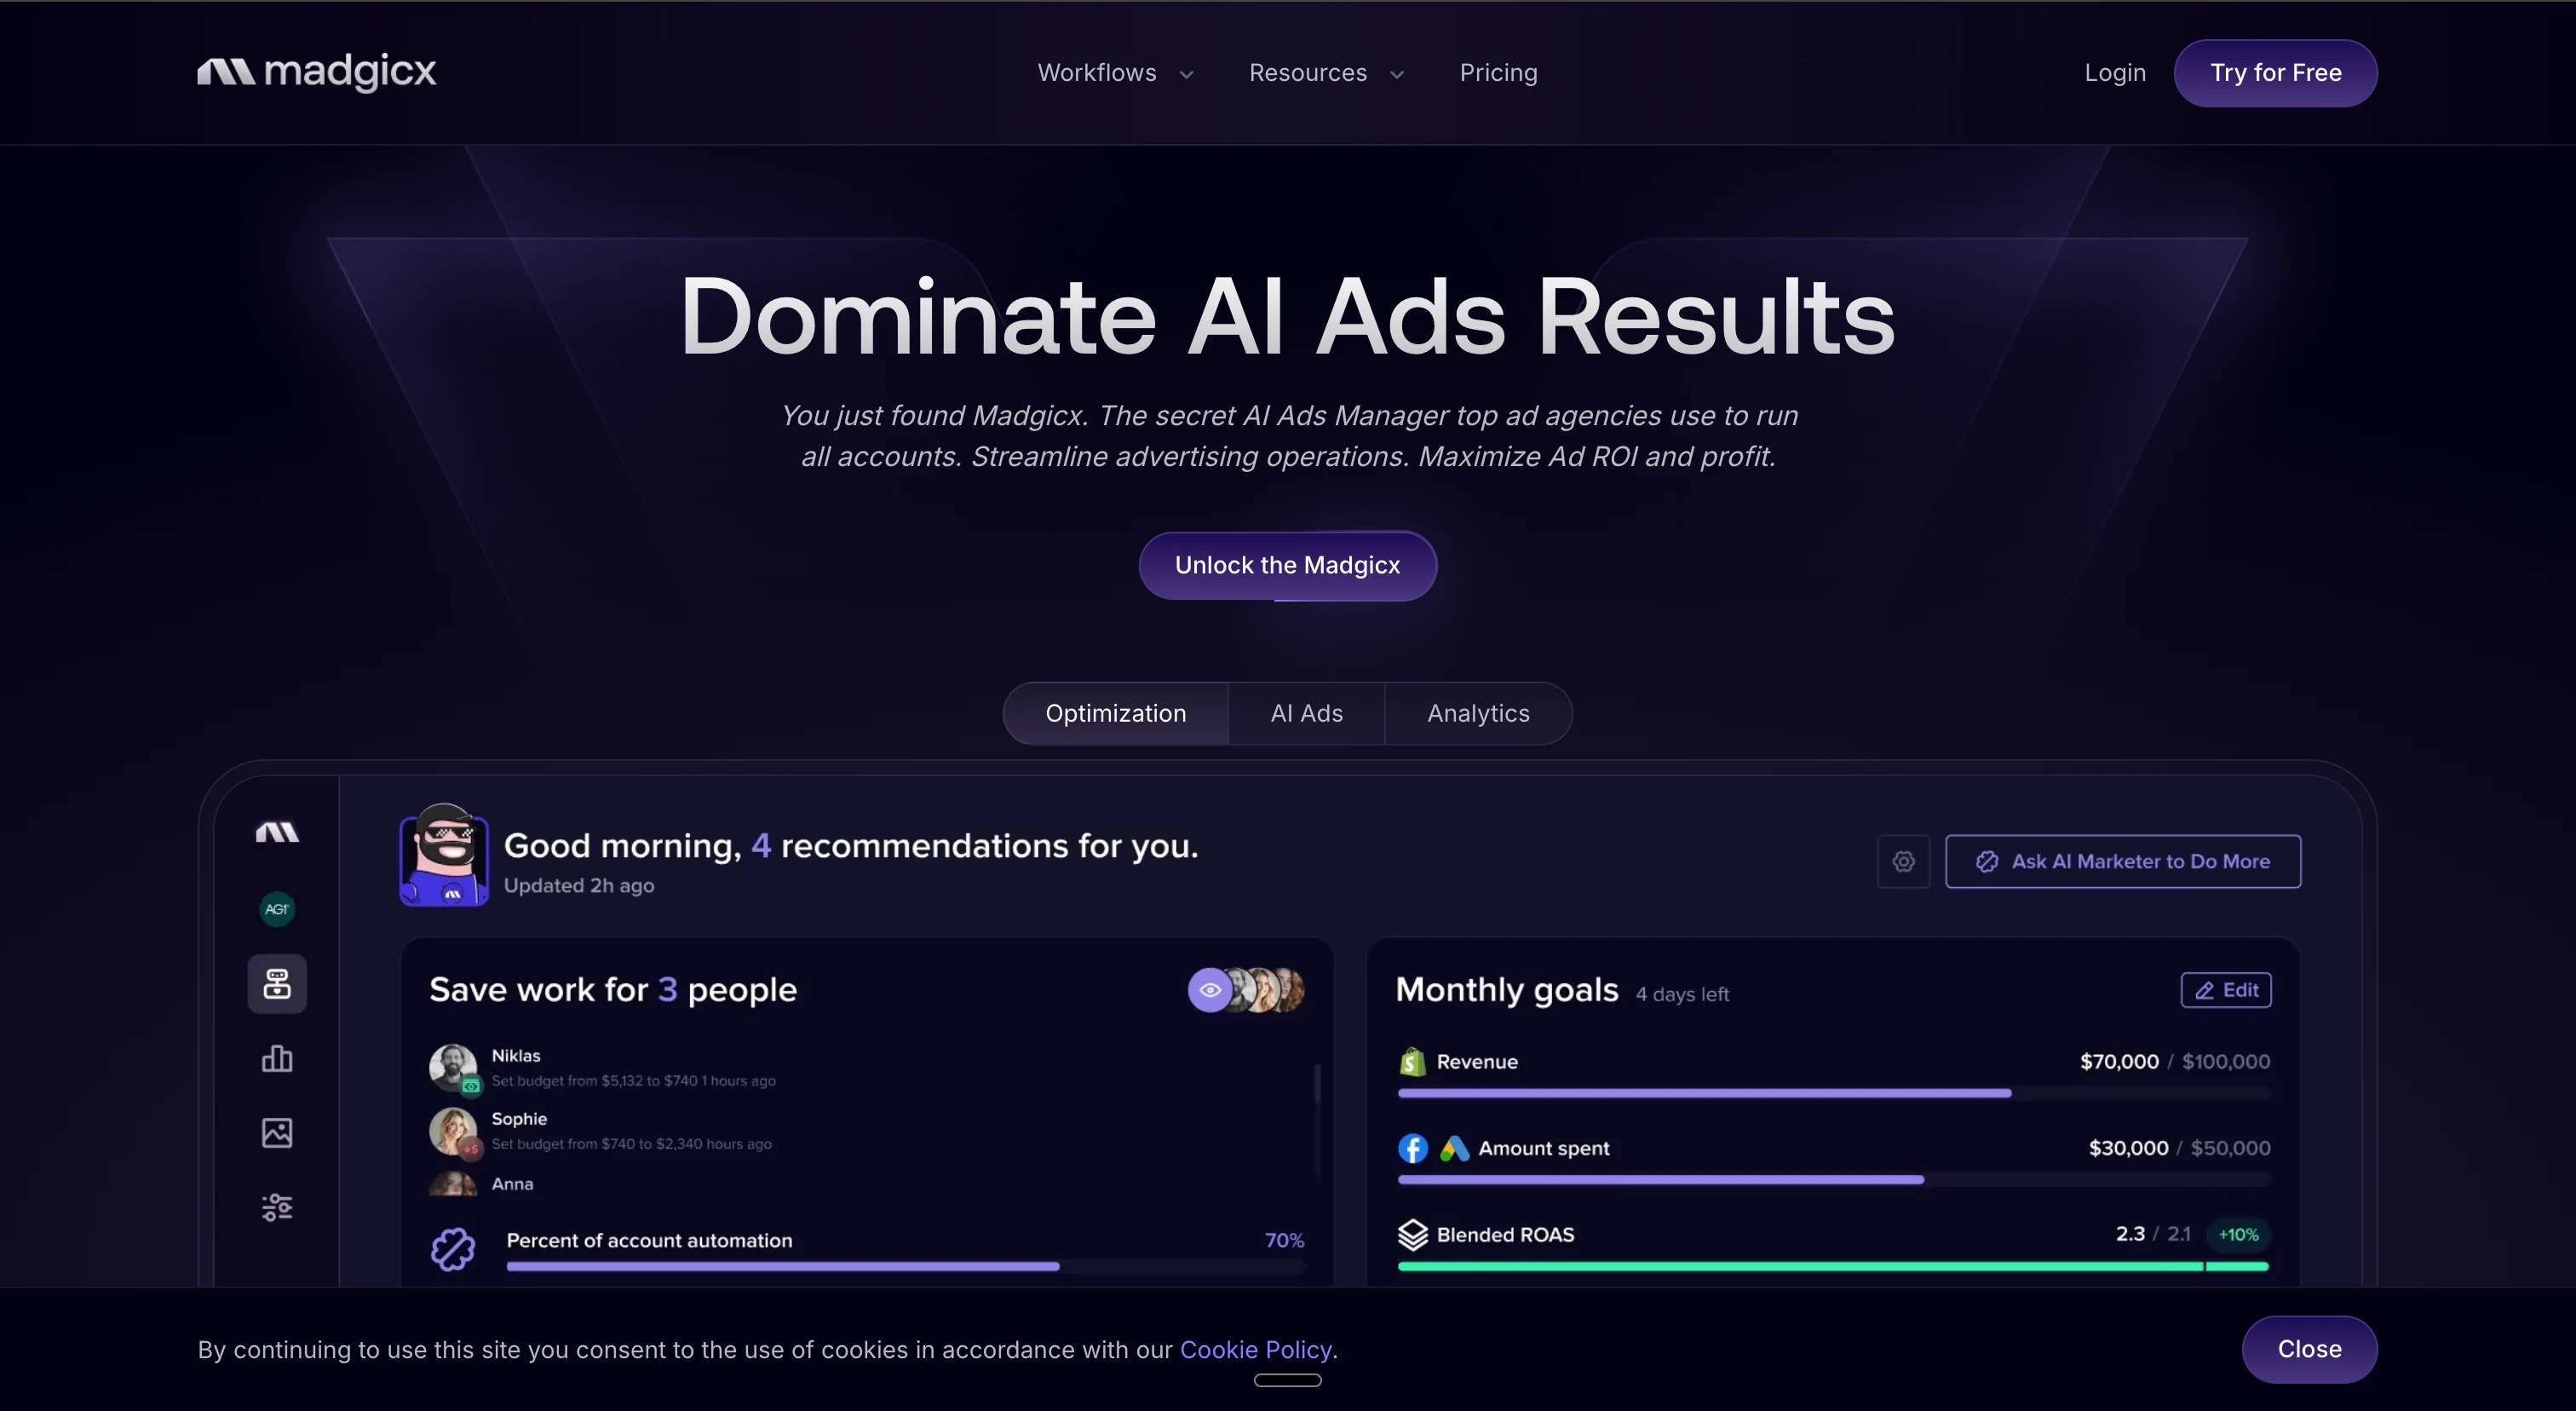
Madgicx is a cross-channel ad management platform with reporting capabilities. It covers Meta, Google, TikTok, Snapchat, and Pinterest, with AI-powered optimization that combines creative performance data with audience and bidding insights.
Madgicx is an ad management tool first, reporting tool second. The creative analytics depth is shallower than dedicated platforms like Hawky or Motion. If you need ad operations and reporting in one place, it covers that. If you need creative intelligence, you'll outgrow it.
Strength: Cross-channel ad management. AI-powered optimization recommendations.
Limitation: Creative analytics is not the core focus. Shallow element-level analysis. Interface can feel complex.
Best for: Agencies who want ad management and basic reporting in one tool.
9. Porter Metrics - Best for Custom Looker Studio Dashboards
Porter Metrics is a data connector for teams using Google Looker Studio. It pulls data from Meta, Google Ads, TikTok, LinkedIn, and other platforms into customizable Looker Studio templates.
Porter Metrics adds creative-level data without requiring a new platform. But it's a connector, not an analytics tool. The analysis, tagging, and insight generation is entirely manual. There's no AI tagging, no fatigue detection, and no competitor tracking.
Strength: Native Looker Studio integration. Low cost of entry.
Limitation: No AI analysis, tagging, or fatigue detection. Manual insight generation only.
Best for: Freelancers and small teams who run their reporting in Looker Studio.
| Tool | Element-Level Analysis | AI Creative Tagging | Fatigue Detection | Competitor Tracking | Platform Coverage |
|---|---|---|---|---|---|
| Hawky | Yes (deep) | ✓ | Predictive | ✓ | Meta, Google Ads, TikTok, Pinterest |
| Motion | Partial | ✓ | — | — | Meta, TikTok, YouTube |
| Superads | — | ✓ | — | New (Apr 2026) | Meta, Google Ads, TikTok |
| Triple Whale | — | Yes (AI agent) | — | — | Meta, TikTok, Google |
| Northbeam | — | — | Basic | — | Multi-channel (attribution-focused) |
| Vidmob | ✓ | ✓ | — | — | Meta (primary) |
| Singular | — | Yes (Creative IQ) | — | — | 3,000+ connectors |
| Madgicx | — | ✓ | — | — | Meta, Google, TikTok, Snap, Pinterest |
| Porter Metrics | — | — | — | — | Meta, Google Ads, TikTok, LinkedIn |
Creative reporting, creative analytics, and creative intelligence are three distinct levels of capability that determine how deeply a tool can explain your ad performance. These terms get used interchangeably, but understanding the distinction helps you buy the right tool for your actual need.
Creative reporting is the baseline. It pulls ad performance data from platforms and displays it in dashboards, charts, and tables. Tools like Porter Metrics live here. You see which ads performed well, but you don't learn why.
Creative analytics adds a layer of analysis on top of reporting. Tools like Motion and Superads automatically tag creative elements and help you identify patterns. You learn that video ads with "problem-agitation" hooks outperform "benefit-first" hooks. That's useful for your next creative brief.
Creative intelligence goes further. It combines analytics with prediction and competitive context. Hawky detects creative fatigue before it impacts your CPA, tracks competitor creative strategies, and generates new creatives from winning patterns. You're anticipating what will happen next, not just reporting what already happened.
Most teams start with reporting, realize they need analytics, and eventually want intelligence. If you're buying a tool today, consider where you'll be in 12 months, not just what you need this week.
The right creative performance reporting tool depends on your ad platforms, monthly spend, team size, and whether you need pure reporting or deeper intelligence. Here are the clearest decision paths.
If you're a performance marketing team or agency running ads on Meta, Google Ads, TikTok, or Pinterest and you want element-level analysis, competitor tracking, and fatigue prediction in one platform, Hawky is built for that exact use case. It's the only tool on this list that covers all four capabilities (analysis, competitor intelligence, fatigue prediction, and AI creative generation) without requiring you to stitch together multiple products.
If your primary need is clean visual reporting for client presentations and you run mostly on Meta, Motion covers that narrower use case.
If you need basic creative analytics across Google Ads and social platforms on a tight budget, Superads is a reasonable starting point.
If you're a Shopify DTC brand that wants creative performance tied to revenue metrics, Triple Whale connects those dots, but only for ecommerce.
If you're spending large budgets and need first-party attribution accuracy alongside creative insights, Northbeam provides the data quality, though creative analysis is secondary.
What is a creative performance reporting tool?
A creative performance reporting tool is software that connects ad creative assets to measurable performance metrics like ROAS, CPA, CTR, and revenue. Unlike standard ad platform reporting that shows campaign-level results, creative performance reporting breaks down which specific creative elements (hooks, visuals, CTAs, copy, format) drive performance. The best tools in 2026 add AI-powered tagging, fatigue detection, and competitive intelligence on top of that reporting foundation.
How do you measure creative performance in paid ads?
Creative performance measurement starts with tracking standard ad metrics (CTR, CPA, ROAS, conversion rate, thumbstop rate for video) at the individual creative level, not just the campaign or ad set level. Advanced measurement tags each creative's elements (hook type, visual style, CTA format) and attributes performance to those elements individually. This lets you identify that "problem-agitation" hooks drive 30% higher CTR than "benefit-first" hooks across your account, rather than just knowing Ad A beat Ad B.
What is the difference between creative analytics and marketing reporting?
Marketing reporting aggregates campaign-level performance data across channels into dashboards and charts. Creative analytics goes deeper by analyzing individual ad creatives, tagging their elements using AI, and identifying which creative patterns drive results.
Marketing reporting tells you your Meta campaigns generated a 3.2x ROAS last month. Creative analytics tells you that UGC-style video ads with text overlay hooks and "Shop Now" CTAs drove 80% of that return. That insight is specific enough to brief your next creative sprint.
How do creative performance reporting tools detect ad fatigue?
Creative fatigue detection tools monitor performance trend lines for individual ad creatives over time. When metrics like CTR begin declining while frequency increases, the tool flags that creative as fatiguing. Predictive fatigue detection (offered by Hawky) uses pattern recognition to flag creatives 3-5 days before the CPA spike hits.
This gives media buyers time to rotate in fresh creatives before performance degrades, preventing the common scenario where a winning ad silently declines for a week before anyone notices.
What metrics should you track for ad creative performance?
The core metrics for creative performance reporting are click-through rate (CTR), cost per acquisition (CPA), return on ad spend (ROAS), conversion rate, and thumbstop rate (for video ads). Beyond these, track creative-level metrics like hook retention rate (what percentage of viewers watch past the first 3 seconds), engagement rate by creative element, frequency-to-fatigue ratio, and creative lifespan (days from launch to fatigue). Tools with element-level analysis let you attribute these metrics to specific hooks, visuals, and CTAs rather than the ad as a whole.
Is it worth paying for creative analytics tools or can you use free alternatives?
Free tools like Google Looker Studio with Porter Metrics connectors or Meta's native Ads Manager can handle basic creative reporting, showing you which ads performed well at the metric level. Paid creative analytics tools become worth the investment when you need automated AI tagging, element-level analysis, fatigue prediction, and competitor intelligence.
Teams spending $10K+/month on paid media typically recoup the tool cost within the first month through faster creative decisions and reduced wasted spend.
If your team is spending hours pulling creative data into spreadsheets and still guessing which elements drive performance, Hawky's element-level creative intelligence is built for that exact problem.