Paid Ad Analytics for Creative Teams: What to Track and What to Fix

After reading this guide, your creative team will know exactly which paid ad analytics metrics matter, how to read them without a media buyer translating, and what to change when performance drops. Most creative teams get paid ad analytics wrong because they're handed the wrong metrics, in the wrong format, at the wrong time. This guide fixes that.
Creative drives up to 70% of a campaign's outcome, yet the people making the creative rarely see the data that tells them what's working. That disconnect is expensive. When creative teams operate without paid ad analytics, they rely on gut instinct, secondhand feedback, and vague requests to "make it better." The result is wasted ad spend, slow iteration cycles, and creatives that repeat the same mistakes.
Paid ad analytics for creative teams is the practice of tracking, interpreting, and acting on performance data at the creative element level, so designers, copywriters, and creative strategists can make informed decisions about hooks, visuals, CTAs, and body copy. This guide walks through the exact metrics to track, the signals that tell you something is broken, and a repeatable process for fixing underperforming ads.
Paid ad analytics prerequisites are the foundational systems your team needs before any metric becomes useful. Before your creative team can act on paid ad analytics, you need three things in place.
Ad account access (read-only is fine). Your creative team needs direct access to Meta Ads Manager, Google Ads, or whatever platform you're running. Secondhand summaries from media buyers lose context. Even view-only access changes the dynamic because creatives can explore the data on their own terms.
A shared naming convention. Every ad, ad set, and campaign needs a consistent naming structure that tags the creative elements: hook type, visual style, CTA variant, and format. Without this, you cannot filter performance by creative element. A naming convention like [Brand][Hook-Type][Visual-Style][CTA][Format]_[Date] makes every downstream analysis possible.
Baseline benchmarks for your account. Pull your last 90 days of data and calculate averages for CTR, CPA, ROAS, hook rate (3-second video views / impressions), and hold rate (15-second views / 3-second views). These become your "normal." Without baselines, every metric is just a number with no meaning.
Here's an example of what a naming convention table looks like in practice:
| Element | Convention | Example |
|---|---|---|
| Brand | Brand abbreviation | ACME |
| Hook Type | Problem, Benefit, Testimonial, UGC, Stat | Problem |
| Visual Style | Lifestyle, Product-Demo, UGC-Raw, Motion-Graphic | UGC-Raw |
| CTA Variant | Shop-Now, Learn-More, Free-Trial, Limited-Offer | Shop-Now |
| Format | Static, Video-15s, Video-30s, Carousel | Video-15s |
The resulting ad name: ACME_Problem_UGC-Raw_Shop-Now_Video-15s_0409. When every ad follows this pattern, you can filter your dashboard by any element and instantly see performance patterns across dozens or hundreds of ads.
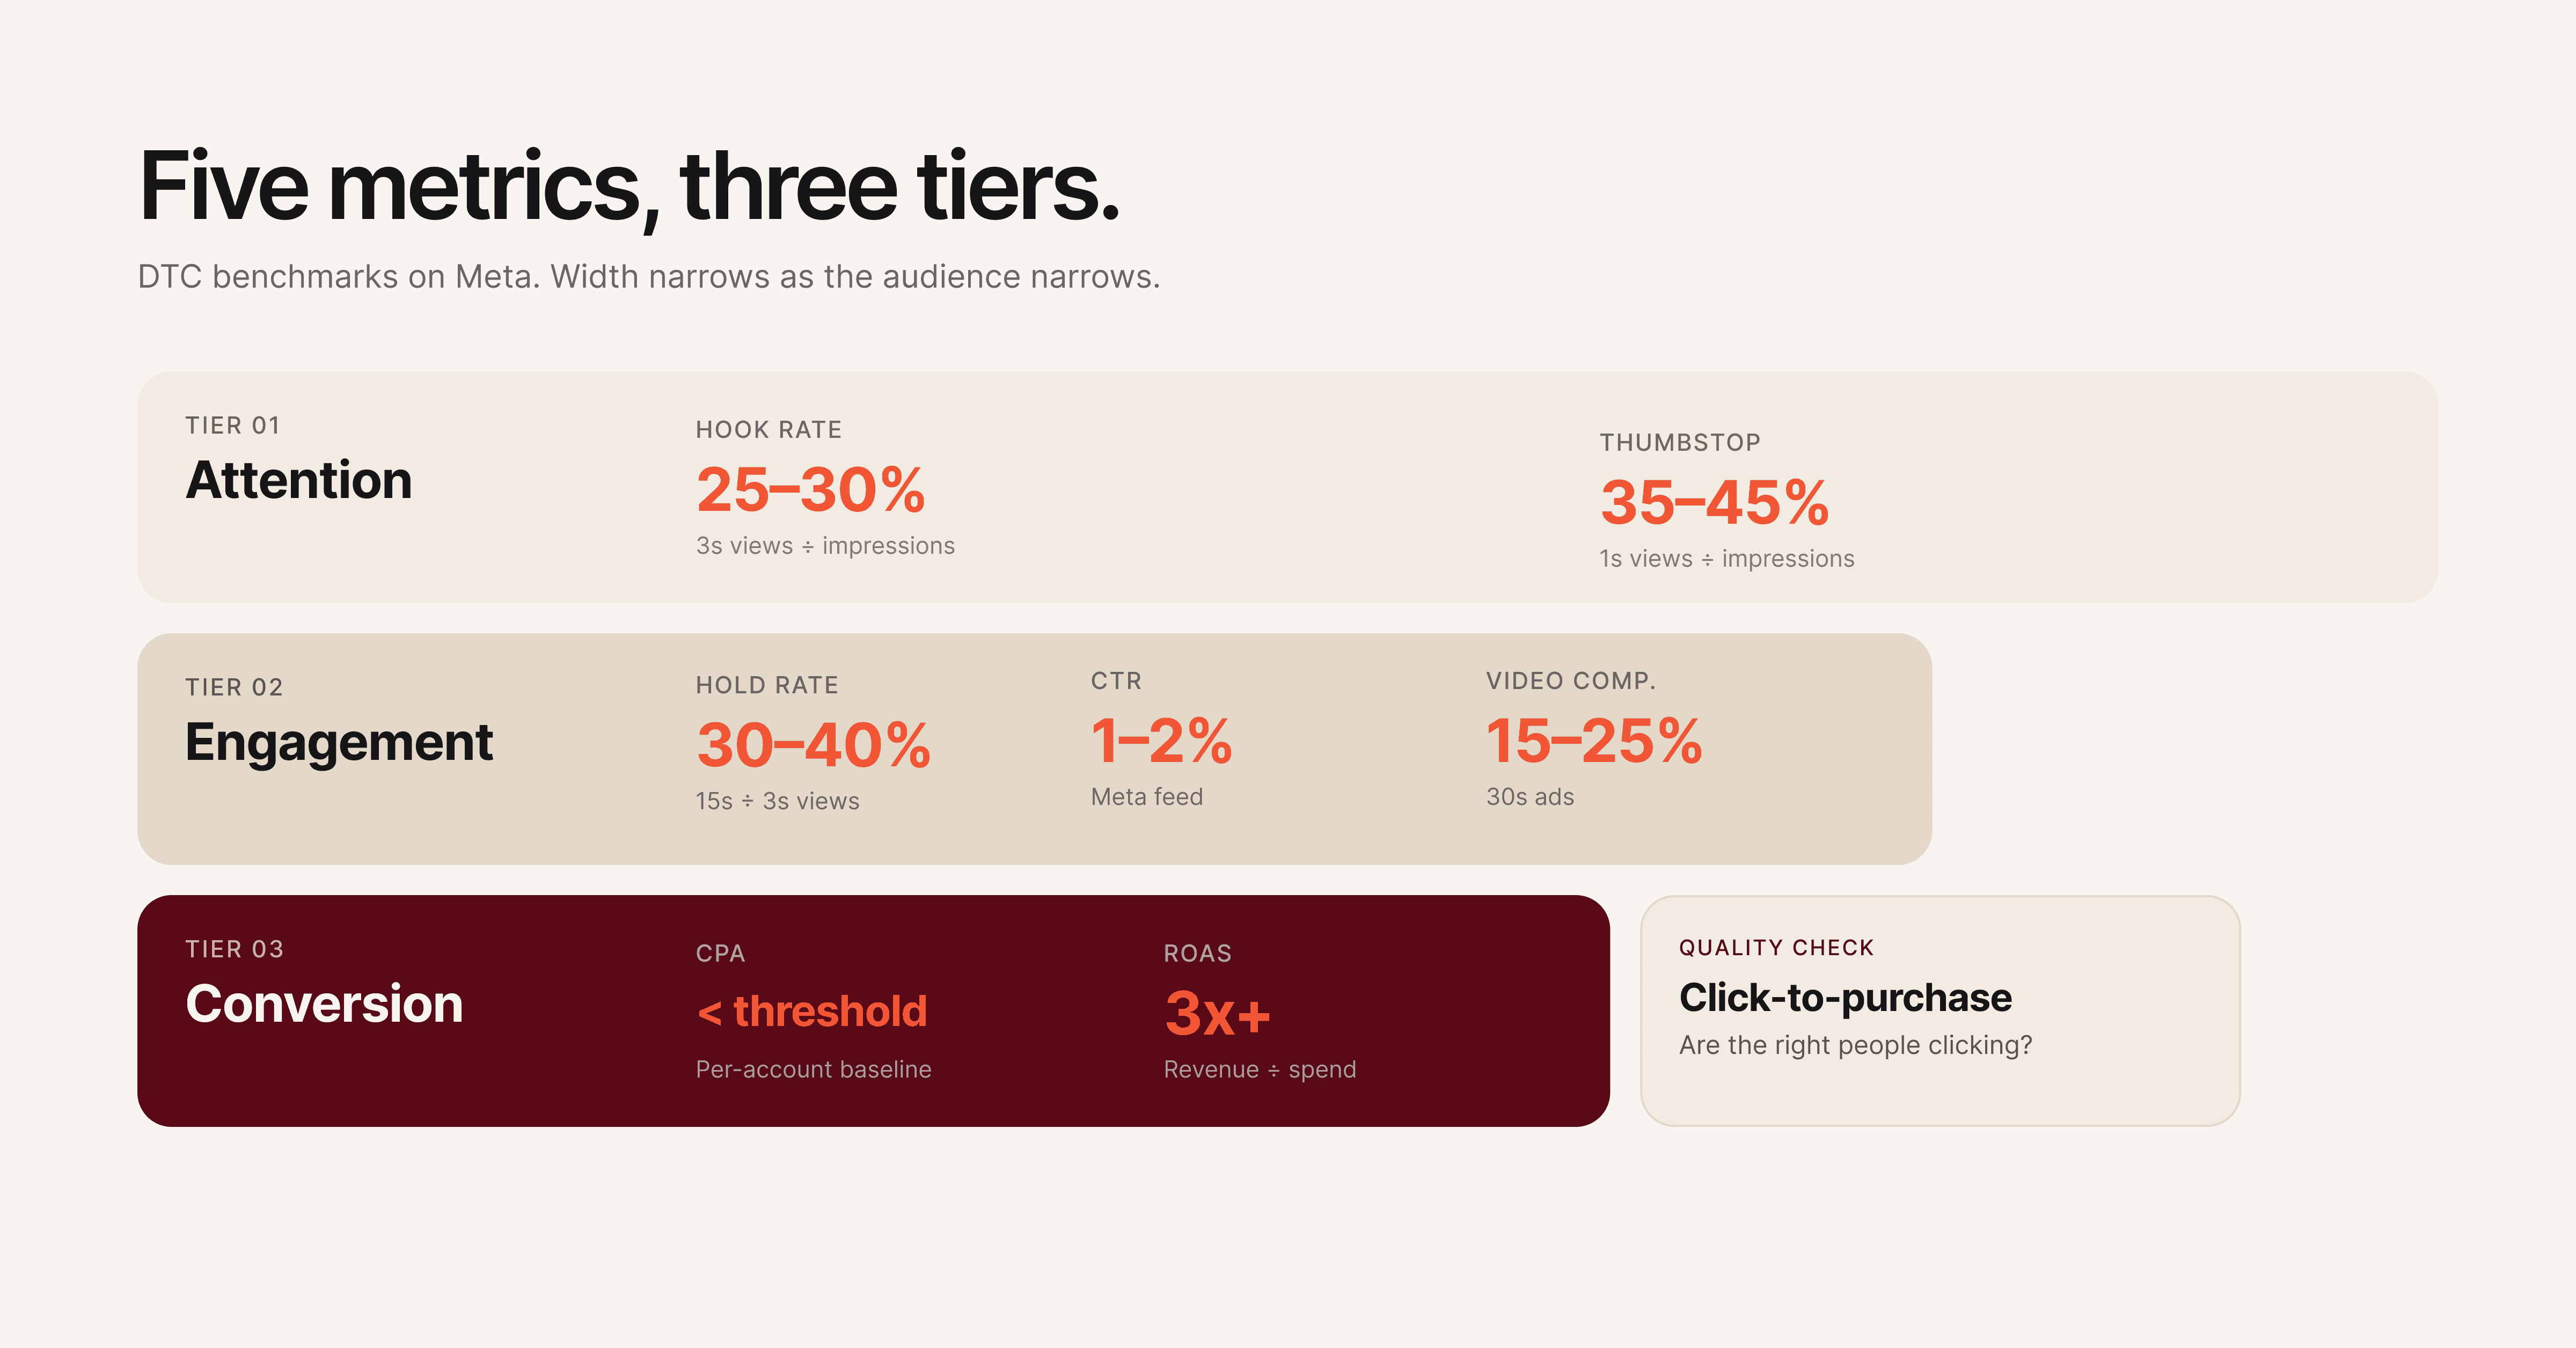
Attention metrics are the performance signals that measure whether your ad stops the scroll. For creative teams, this is the first diagnostic layer because attention is the one thing creative controls completely.
Hook rate is the percentage of people who watch at least 3 seconds of your video ad, calculated as 3-second video views divided by impressions. A strong hook rate for DTC brands typically lands between 25-30%. For mobile apps and gaming, the bar is closer to 30-35%. If your hook rate is below 20%, the opening frame or first 3 seconds of your video is failing to capture attention.
Thumbstop rate measures the percentage of users who pause their scroll on your ad. On Meta, this maps closely to the 1-second video view rate or engagement rate on static ads. A declining thumbstop rate across your ad set means the visual or headline isn't distinct enough to interrupt the feed.
| Metric | Formula | Good Benchmark (DTC) | What It Tells You |
|---|---|---|---|
| Hook Rate | 3-sec views / Impressions | 25–30% | Is your opening strong enough to capture attention? |
| Thumbstop Rate | 1-sec views / Impressions | 35–45% | Does your ad visually stand out in the feed? |
| Impression-to-Click Ratio | Clicks / Impressions | 1.5–3% | Is the first impression compelling enough to act on? |
When attention metrics drop, the fix is almost always in the first frame, headline, or thumbnail. Don't change the entire ad. Change the hook.
Pro tip: Track attention metrics separately for each placement (Feed, Stories, Reels). A hook that works in Feed often fails in Reels because the viewing context and pacing are completely different.
For static ads, attention metrics look different. You won't have hook rate or hold rate. Instead, track thumbstop rate and the ratio of impressions to outbound clicks. A static ad with a 0.8% impression-to-click ratio in a feed full of 1.5% performers needs a stronger headline, a more contrasting color palette, or a more disruptive visual composition.
Creative teams should review attention metrics first because these are the metrics they have the most direct control over. A media buyer can't fix a weak hook. Only the creative team can.
Engagement metrics are the indicators that measure what happens after a user stops scrolling on your ad. High attention with low engagement means your hook promises something the rest of the ad doesn't deliver.
Hold rate measures the percentage of 3-second viewers who continue watching to 15 seconds. Calculate it as 15-second views divided by 3-second views. A healthy hold rate sits between 30-40% for most verticals. If your hook rate is strong but your hold rate drops below 25%, you have a classic "clickbait" problem: the opening grabs attention, but the creative doesn't sustain it.
Click-through rate (CTR) remains one of the most reliable engagement signals. For paid social ads, benchmark CTRs range from 1-2% on Meta and 0.5-1.5% on Google Display. CTR tells you whether the combination of visual, copy, and CTA was compelling enough to drive action.
Video completion rate matters for longer-form creatives (15 seconds and above). A completion rate below 15% on a 30-second video signals that the middle section drags or the narrative loses the viewer.
| Metric | Formula | Good Benchmark | What It Tells You |
|---|---|---|---|
| Hold Rate | 15-sec views / 3-sec views | 30–40% | Does the creative sustain interest after the hook? |
| CTR | Clicks / Impressions | 1–2% (Meta) | Is the full creative compelling enough to drive action? |
| Video Completion Rate | Completed views / Started views | 15–25% (30-sec video) | Does the narrative hold through the end? |
| Engagement Rate | (Likes + Comments + Shares) / Impressions | 0.5–1.5% | Does the creative trigger a reaction beyond clicking? |
When engagement drops while attention holds steady, focus on the body of the creative. The hook is doing its job, but the visual narrative, pacing, or value proposition in the middle section needs work.
One pattern that shows up repeatedly: teams see a 28% hook rate but only a 12% hold rate. The creative opens strong with a bold claim or eye-catching visual, then transitions into a slow product walkthrough that doesn't match the energy of the opening. The fix isn't a new ad. It's tightening the first 15 seconds to deliver the value proposition faster and maintaining visual pacing with cuts every 2-3 seconds.
Conversion metrics are the numbers that tie creative performance directly to business outcomes like revenue, signups, and leads. Creative teams don't need to own these metrics, but they need to see them clearly tied to specific ads and creative elements.
Cost per acquisition (CPA) tells you how much it costs to drive a conversion (purchase, signup, lead) from a specific ad. When CPA rises on an ad that previously performed well, it's a signal of creative fatigue, audience saturation, or both. Creative teams should know the CPA threshold: the number above which an ad is no longer profitable.
Return on ad spend (ROAS) measures revenue generated per dollar of ad spend. A ROAS of 3x means every $1 spent returns $3 in revenue. ROAS gives creative teams a direct line between their work and business impact. Knowing that Ad A delivers a 4.2x ROAS while Ad B delivers 1.8x makes the conversation about "what works" concrete instead of subjective.
Click-to-purchase ratio measures how many clicks convert to purchases. A high CTR with a low click-to-purchase ratio means the creative is attracting clicks but not the right ones. The ad might be misleading, targeting the wrong audience, or setting expectations the landing page doesn't meet.
This metric is particularly important for creative teams because it reveals a subtle but costly problem: ads that "test well" on engagement but fail on revenue. A creative team might celebrate a 2.5% CTR, but if only 1 in 50 of those clicks converts, the ad is generating expensive traffic that doesn't pay for itself. Tracking click-to-purchase ratio forces the conversation from "did people click?" to "did the right people click?"
| Metric | What Creative Teams Should Know |
|---|---|
| CPA | Your profitability threshold. Know the number. Ads above it need creative changes or should be paused. |
| ROAS | The direct ROI of your creative work. Compare across ads to see which creative elements drive revenue. |
| Click-to-Purchase Ratio | Quality check. Low ratios mean the creative attracts interest but doesn't convert. Misalignment between ad and landing page is the usual cause. |
| Cost Per Lead (CPL) | For lead-gen campaigns, this replaces CPA. Track it by creative variant to find which hooks and CTAs generate the cheapest qualified leads. |
Pro tip: Ask your performance team to share a weekly snapshot showing the top 5 and bottom 5 ads by CPA or ROAS. This single report gives creative teams more actionable intelligence than a full dashboard most weeks.
A dashboard only works if creative teams open it. Most analytics dashboards are built by and for media buyers, packed with campaign-level metrics that mean nothing to a designer or copywriter.
Structure it by creative element, not by campaign. The most useful dashboard for creative teams organizes data by hook type, visual style, CTA variant, and format rather than by campaign or ad set. This lets your team answer questions like "which hook style has the lowest CPA this month?" instead of "how is Campaign #47 doing?"
Include visual references. Pair every data row with a thumbnail of the actual creative. Designers and copywriters think visually. A table of numbers without the associated images makes it harder to connect data to creative decisions.
Limit the metrics shown. Creative teams don't need 20 metrics. Show five: hook rate, hold rate, CTR, CPA, and ROAS. Everything else is noise for the people making the ads. If a specific situation requires deeper data, they can drill down.
Update frequency matters. A dashboard that updates weekly is useful. One that updates monthly is an autopsy report. Daily or real-time updates are ideal for high-spend accounts ($50k+ per month), but weekly updates work for most teams. The goal is catching creative fatigue before it wastes significant budget.
Here's a recommended dashboard structure for creative teams:
| Dashboard Section | Metrics Shown | View By |
|---|---|---|
| Attention Performance | Hook Rate, Thumbstop Rate | Hook type, Format |
| Engagement Performance | Hold Rate, CTR, Video Completion Rate | Visual style, Ad length |
| Conversion Performance | CPA, ROAS, Click-to-Purchase Ratio | CTA variant, Offer type |
| Creative Health | Trend lines (7-day rolling average) | Individual ad |
| Top/Bottom Performers | Top 5 and Bottom 5 by CPA | Full creative with thumbnail |
Tools like Hawky's Creative Analysis break down ad performance at the element level automatically, so creative teams can see which hooks, visuals, and CTAs drive results without building custom dashboards from scratch.
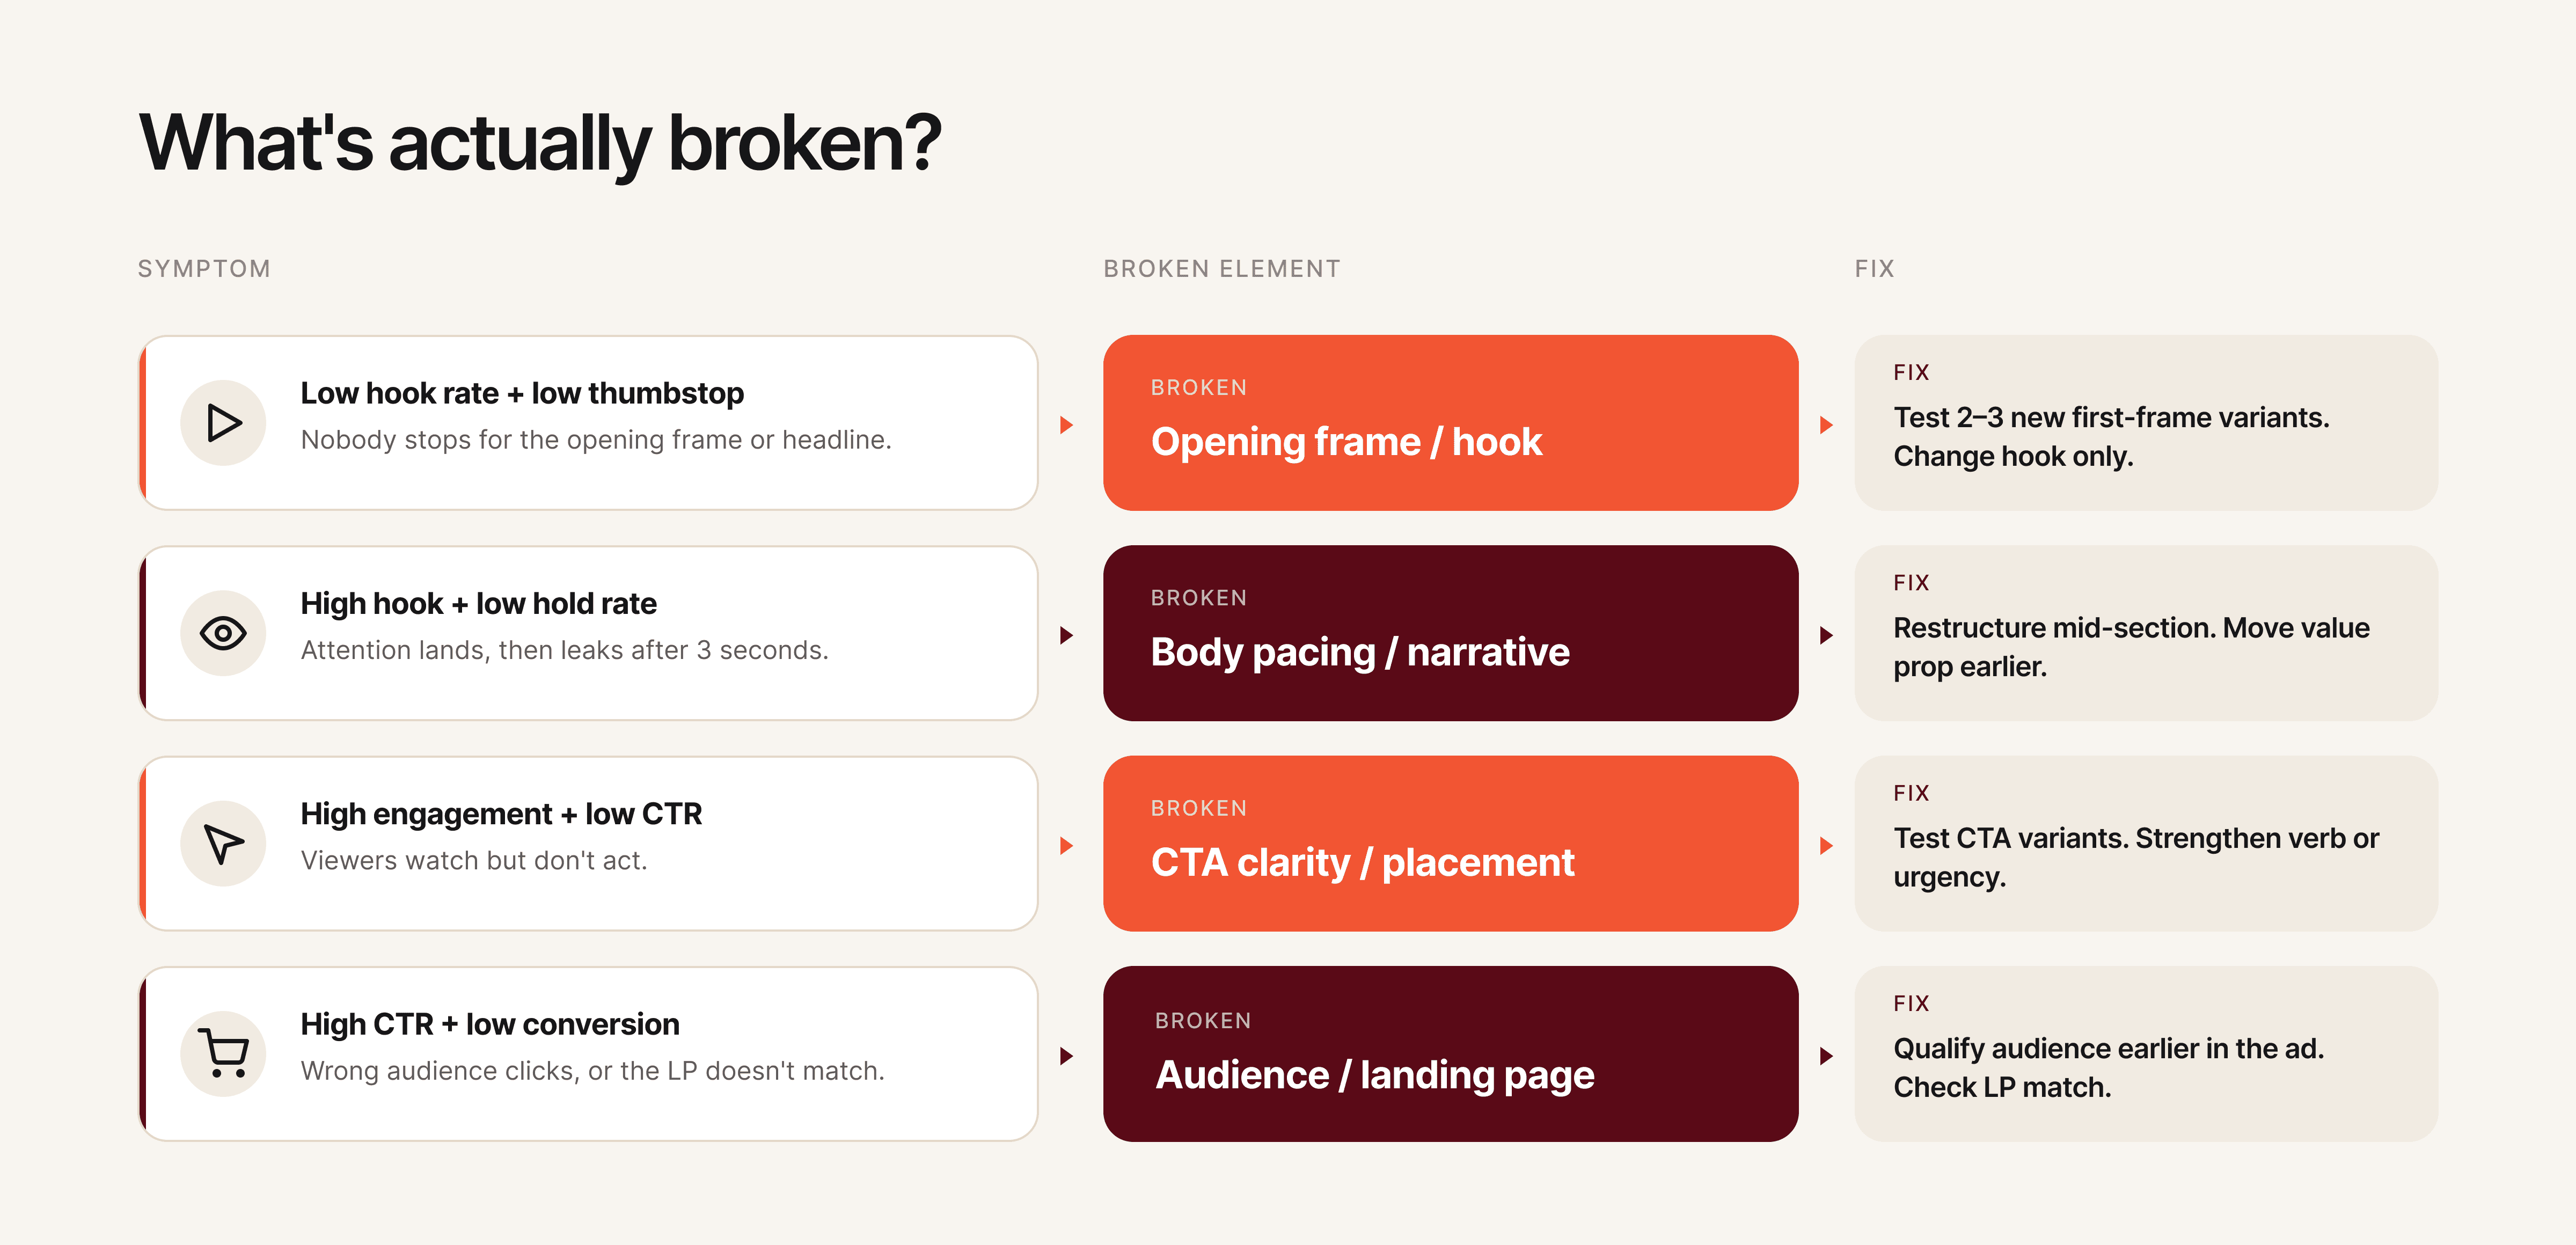
Element-level analysis is the process of diagnosing which specific component of an ad is underperforming rather than judging the ad as a whole. Most teams troubleshoot ads at the ad level: "Ad #12 isn't working, replace it." That approach throws away the 60% of the ad that was working fine and restarts from zero.
Element-level analysis means diagnosing which specific component of the ad is underperforming: the hook, the visual narrative, the body copy, or the CTA. This is where creative analytics separates from standard ad analytics.
Diagnosing hook problems. Low hook rate + low thumbstop rate = the opening visual or headline fails to stop the scroll. The fix is a new first frame, a stronger opening line, or a pattern-interrupting visual element. Don't change the rest of the ad until you've tested at least 2-3 hook variants against the same body.
Diagnosing retention problems. Strong hook rate + weak hold rate = the creative grabs attention but loses it. This usually means the pacing is too slow after the hook, the value proposition takes too long to appear, or the visual variety drops off. Restructure the middle section, move the key benefit closer to the front, or add visual cuts to maintain pacing.
Diagnosing CTA problems. Strong engagement metrics + weak CTR or conversion rate = the viewer watched and was interested but didn't act. The CTA is either too weak, positioned wrong, or misaligned with the ad's emotional tone. Test different CTA placements, change the action verb, or add urgency without resorting to false scarcity.
Diagnosing audience mismatch. Strong CTR + weak click-to-purchase ratio = the ad attracts clicks from the wrong people. The creative might appeal broadly but not to the purchase-ready segment. Tighten the messaging to qualify the audience earlier in the ad (mention price point, use case specificity, or "this is for [specific persona]" framing).
Hawky's element-level analysis automates this diagnostic process by scoring each component of your ads (hook, visual, CTA, body copy) individually, so teams can pinpoint exactly what needs to change instead of guessing.
A data-backed creative fix process is a structured method for changing only the broken element of an ad while preserving everything that works. Once you know what's broken, follow this process to fix it without losing what's working.
Step 6a: Isolate the underperforming element. Using the diagnostic table from Step 5, identify the single element most likely causing the drop. Resist the temptation to change multiple things at once. Changing the hook, visual, and CTA simultaneously tells you nothing about which change made the difference.
Step 6b: Generate 3-5 variants of that element only. If the hook is the problem, create 3-5 new hooks and pair each with the same body, visual, and CTA from the original ad. This is the foundation of structured creative testing: the only variable is the element you're fixing.
Step 6c: Run the test with proper structure. Allocate equal budget across variants. Let each variant accumulate at least 1,000 impressions (ideally 5,000+) before making any decisions. On Meta, use the A/B test feature or run variants in the same ad set with dynamic creative turned off.
Step 6d: Evaluate against the baseline, not against each other. The goal isn't finding the "best" variant. It's finding variants that beat your baseline benchmarks from Step 0. An ad that beats your average CPA by 15% is a winner, even if another variant beats it by 20%. Both go into rotation.
Step 6e: Document what worked and why. After every test cycle, record the winning element, the hypothesis behind it, and the performance delta. Over time, this builds an institutional knowledge base of what works for your brand, audience, and market. This is how creative teams stop relying on hunches and start building repeatable frameworks.
Here's an example of what a test documentation entry looks like:
| Field | Entry |
|---|---|
| Ad tested | ACME_Problem_UGC-Raw_Shop-Now_Video-15s_0315 |
| Element changed | Hook (first 3 seconds) |
| Original hook | Product demo opening with logo |
| Winning variant | Customer pain point question: "Still spending 4 hours on reports?" |
| Hypothesis | Problem-framing hooks outperform product-first hooks for cold audiences |
| Performance delta | Hook rate: +34% (from 22% to 29.5%). CPA: -18% (from $28 to $23). |
| Insight | Pain-point questions in text overlay outperform voiceover-only hooks for DTC audiences on Meta Feed placements. |
After 10-20 entries, patterns emerge that are specific to your brand: which hook styles work for which audiences, which visual formats sustain attention longest, and which CTA placements drive the highest conversion rates. This documentation becomes the creative team's strategic advantage.
Hawky's Playbooks feature turns winning creative patterns into documented systems that the entire team can reference. Instead of one person knowing what works, the knowledge becomes shared infrastructure.
Tracking too many metrics at once. When creative teams first get access to analytics, the instinct is to track everything. Twenty metrics on a dashboard creates information overload, not insight. Start with five (hook rate, hold rate, CTR, CPA, ROAS) and add more only when specific questions demand it.
Optimizing for vanity metrics. Impressions, reach, and engagement rates feel good but don't correlate with revenue. An ad with 50,000 likes and a 0.8x ROAS is actively losing money. Creative teams should anchor every decision to CPA or ROAS, not social validation.
Changing entire ads instead of elements. When an ad underperforms, the default move is to scrap it and start over. That wastes whatever was working in the original. Use element-level analysis to find the broken piece and fix only that.
Ignoring creative fatigue until CPA spikes. Creative fatigue is a gradual decline, not a cliff. By the time CPA spikes, you've already wasted weeks of budget on declining performance. Track 7-day rolling averages for your top ads and start refreshing when metrics decline 15-20% from their peak.
No feedback loop between performance and creative. Data without a process for acting on it is just information. Establish a weekly 15-minute creative analytics review where the performance team walks through top and bottom performers, and the creative team commits to specific iterations. This single habit changes everything.
Comparing creative performance across platforms without normalizing metrics. A 2% CTR on Meta and a 2% CTR on Google Display don't mean the same thing. Platform benchmarks, audience intent, and placement contexts differ significantly. Before comparing cross-platform creative performance, normalize metrics against platform-specific baselines. Otherwise, you'll kill creatives that are actually winning on their platform.
A cross-team analytics workflow is a structured cadence of meetings, shared tools, and documentation that keeps creative and performance teams aligned on data. The most common reason creative teams ignore analytics isn't lack of interest. It's lack of process. Data exists in one team's tools, insights stay in one team's meetings, and action items get lost in Slack threads.
Weekly creative analytics standup (15 minutes). The performance team shares a single-page report: top 5 ads by ROAS, bottom 5 ads by CPA, and any ads showing fatigue signals. The creative team identifies which elements are driving winners and which elements appear in losers. The meeting ends with 2-3 specific creative iterations assigned for the following week.
Shared creative performance tracker. A running document (spreadsheet or tool) where every ad's performance is logged alongside its creative elements. Over time, this tracker becomes a searchable database of what works. When a designer starts a new ad, they can filter by hook type, audience, or format to see historical performance before choosing a direction.
Creative brief with analytics context. Every new creative brief should include performance data from the most recent comparable ads. Instead of "make a new video for the spring campaign," the brief reads: "UGC-style hooks are outperforming product-demo hooks by 40% on hook rate. The top-performing CTA this quarter is 'See the difference.' Create 3 new 15-second UGC videos using problem-framing hooks and the winning CTA." That's a brief a creative team can execute against with confidence.
Monthly creative performance retrospective. Once a month, the creative and performance teams review the past 30 days together. Which creative elements had the highest ROAS? Which hook styles are fatiguing fastest? This retrospective feeds directly into the next month's creative strategy and prevents teams from repeating patterns that have already stopped working.
Research from Nielsen suggests that creative quality drives roughly 50% of ROI in paid advertising. Connecting creative teams to analytics doesn't just improve workflow efficiency. It directly impacts the bottom line. Teams that implement structured analytics workflows report faster iteration cycles, lower CPAs, and fewer wasted creative resources.
Hawky provides element-level creative analysis, breaking down performance by hook, visual, CTA, and body copy. It also includes predictive creative fatigue detection so teams catch declining creatives before CPA spikes, competitor creative intelligence for benchmarking against the market, and an AI creative generation engine that builds new variants from winning patterns. For creative teams specifically, Hawky's Command Center surfaces prioritized tasks so designers know exactly what to work on next. Univest used Hawky's element-level creative intelligence to increase CTR by 20% within 7 days.
Motion focuses on creative analytics for paid social, offering visual-first dashboards that group creatives by performance patterns. Strong for teams that want a simple, visual interface for spotting winners and losers quickly.
Supermetrics pulls advertising data from multiple platforms into spreadsheets, dashboards, or data warehouses. Best for teams that want raw data flexibility and already have a BI tool or custom reporting setup.
Triple Whale provides attribution and creative analytics with a focus on Shopify brands. Strong on first-party data tracking and post-purchase attribution for e-commerce teams running heavy paid social.
Improvado serves as a marketing data pipeline that centralizes creative metadata and performance data. Best for enterprise teams with complex multi-platform setups that need automated data normalization before analysis.
For a full comparison of creative analysis platforms, see our guide to the best ad creative analysis tools in 2026. When evaluating tools, creative teams should prioritize three capabilities: element-level creative breakdown (not just ad-level metrics), visual dashboards with creative thumbnails (not spreadsheet-style reports), and automated fatigue alerts (not manual monitoring). A tool that requires a data analyst to configure every report defeats the purpose of giving creative teams direct analytics access.
What metrics should creative teams track for paid ads?
Creative teams should track five core metrics: hook rate (3-second video views divided by impressions), hold rate (15-second views divided by 3-second views), click-through rate, cost per acquisition, and return on ad spend. These five metrics cover the full funnel from attention to conversion and give creative teams enough signal to make informed design decisions without information overload.
How do you know when an ad creative is fatigued?
Creative fatigue shows up as a gradual decline in performance metrics over 7-14 days, not a sudden drop. Watch for hook rates declining 15-20% from their peak, rising CPAs on previously strong ads, and declining CTRs despite stable impression volume. Start planning refreshes when you see the trend forming, not after the metrics hit bottom.
What is element-level creative analysis?
Element-level creative analysis breaks down ad performance by individual components: hook, visual narrative, body copy, and CTA. Instead of knowing only that "Ad #12 has a high CPA," element-level analysis reveals that the hook is performing well but the CTA is underperforming. This precision prevents teams from discarding effective elements when fixing underperformers.
How often should creative teams review ad analytics?
Weekly reviews are the minimum cadence for most teams. High-spend accounts (above $50k per month) benefit from daily monitoring. The most effective format is a 15-minute weekly standup where the performance team shares top and bottom performers with associated element-level data, and the creative team commits to specific iterations for the following week.
What is the difference between ad analytics and creative analytics?
Ad analytics tracks campaign-level performance: spend, impressions, clicks, conversions, and ROAS across ad sets and campaigns. Creative analytics goes deeper, measuring performance at the individual creative and creative element level. The distinction matters because two ads in the same campaign can have wildly different performance, and only creative analytics reveals why.
How do you improve ROAS through creative optimization?
Improving ROAS through creative starts with identifying which creative elements correlate with higher returns. Track ROAS by hook type, visual style, CTA variant, and format. Double down on the elements that appear in your top-performing ads. Use isolation testing (changing one element at a time) to validate that specific elements actually cause better performance rather than correlating by coincidence.
Start Tracking What Matters
Most creative teams are stuck in a cycle of producing ads, waiting for vague feedback, and guessing what to change. Breaking that cycle starts with the right metrics, a shared dashboard, and a clear process for turning data into creative decisions.
If your creative team is making ad decisions without element-level performance data, Hawky's Creative Analysis is built for that job. It breaks down every ad by hook, visual, CTA, and copy, scores each element individually, and surfaces exactly what to fix next.