What Is a Good ROAS? Benchmarks and the Break-Even Math
A good ROAS is any return above your break-even point that still leaves room for profit, which for most businesses lands between 3:1 and 5:1. The common rule of thumb is 3:1, or three dollars of revenue for every dollar of ad spend, but the honest answer depends on your profit margin, not an industry average. A 3x ROAS is excellent for a software brand with 85% margins and a loss for an apparel brand at 30%.
Return on ad spend is the metric marketers argue about most and understand least. This guide defines it, gives you real 2026 benchmarks by platform, and shows you the one calculation that tells you what "good" means for your specific business.
What is ROAS?
ROAS (return on ad spend) is the revenue you earn for every dollar you spend on advertising, expressed as a ratio. If you spend $1,000 on ads and generate $4,000 in revenue, your ROAS is 4:1, often written as 4x or 400%. The formula is simple: revenue from ads divided by cost of ads.
ROAS measures advertising efficiency, not profit. It tells you how hard your ad dollars are working to produce revenue, but it says nothing about whether that revenue is profitable once you subtract the cost of the product, shipping, and overhead. That distinction is where most confusion about "good" ROAS begins. For a full definition, see the ROAS glossary entry.
The metric is popular because it is direct and platform-native. Meta, Google, and TikTok all report it in their ad managers, so it is the number most performance marketers watch daily to judge whether a campaign is pulling its weight.
How to calculate ROAS (with an example)
ROAS is calculated by dividing revenue attributed to your ads by the amount you spent on those ads. The result is a ratio, and you can express it as a number (4x), a ratio (4:1), or a percentage (400%). All three say the same thing.
Take a concrete case. A skincare brand spends $5,000 on a Meta campaign in a month and that campaign drives $18,000 in tracked sales. Divide $18,000 by $5,000 and the ROAS is 3.6x. For every dollar the brand put into that campaign, it got $3.60 in revenue back.
The number looks healthy, but it is only half the story. If that brand runs a 35% gross margin, its break-even ROAS is 2.86x, so a 3.6x return is genuinely profitable. If the same brand ran a 20% margin, break-even would be 5x, and that identical 3.6x campaign would be losing money on every sale. The calculation is easy; interpreting it against your margin is the part that matters.
One caution on the revenue input: attribution decides what counts. Platform-reported revenue often over-credits the ad because of view-through and last-click attribution, so your platform ROAS usually reads higher than your true blended ROAS across the business. Serious advertisers reconcile platform numbers against actual sales, per guidance from Triple Whale and other attribution tools.
What is considered a good ROAS?
A good ROAS is one that clears your break-even point with enough margin left to grow. There is no universal number, because the same ratio means opposite things at different margins. The widely cited 3:1 benchmark is a starting reference, not a target you should adopt without checking it against your own economics.
For most businesses, a ROAS between 3:1 and 5:1 is considered healthy. Expressed the other way, what is a good ROAS percentage works out to 300% to 500%, because the ratio and the percentage are the same number said differently. Below 2:1, most advertisers are losing money once product and operating costs are counted. Above 5:1, you are likely profitable but may be under-spending, leaving growth on the table by not pushing into slightly lower-return but still-profitable audiences.
The trap is chasing a high ROAS for its own sake. A 10:1 ROAS can signal a scaling problem, not a win, because it often means you are only reaching your warmest, cheapest audience and refusing to spend into growth. Efficiency and scale pull against each other, and the right balance depends on whether you are optimizing for margin or market share this quarter.
The break-even ROAS calculation
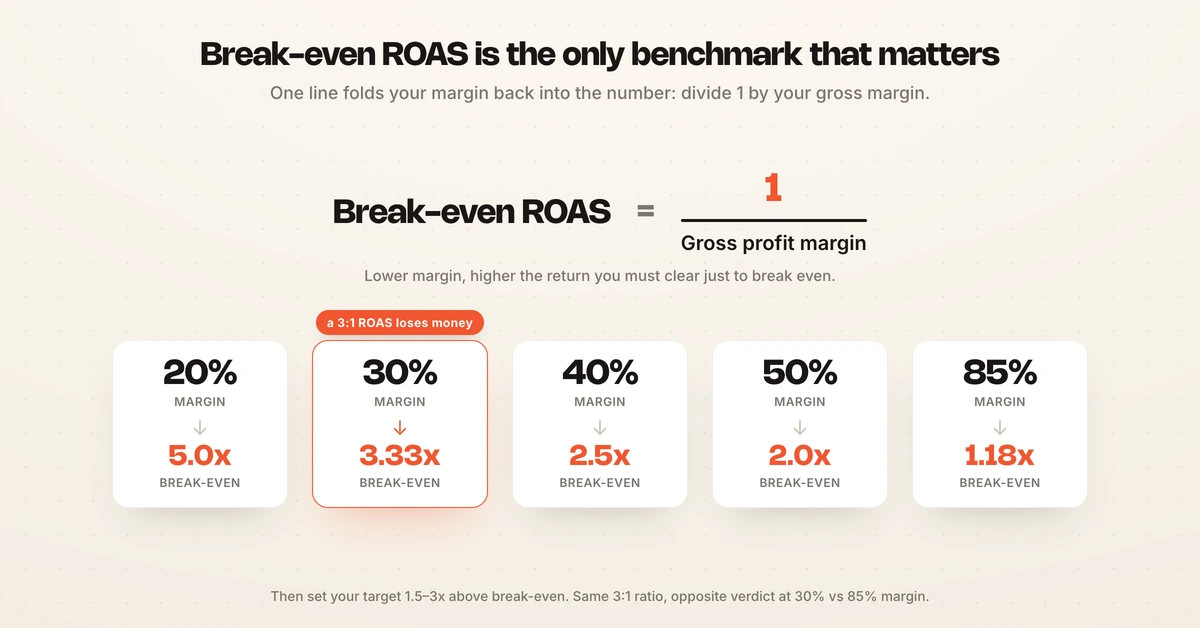
Break-even ROAS is the exact ratio at which your ad revenue covers your costs, and it is the only benchmark that matters for your business. The formula is one line: break-even ROAS equals 1 divided by your gross profit margin, a calculation Shopify and most profit-first advertisers treat as the real starting point. Gross margin is the quick version; once discounts, shipping, payment fees and returns are counted the real figure is usually higher, which is what Hawky's break-even ROAS calculator computes.
| Gross profit margin | Break-even ROAS | Target ROAS (1.5–3x break-even) |
|---|---|---|
| 20% | 5.0x | 7.5x – 15x |
| 30% | 3.33x | 5.0x – 10x |
| 40% | 2.5x | 3.75x – 7.5x |
| 50% | 2.0x | 3.0x – 6.0x |
| 70% | 1.43x | 2.1x – 4.3x |
| 85% | 1.18x | 1.8x – 3.5x |
Read the table against your own margin. An apparel brand at 30% margin needs 3.33x just to break even, so a "good" 3:1 ROAS is actually a small loss. A digital course at 85% margin breaks even at 1.18x, so almost any campaign above 2x is highly profitable. Same ratio, opposite verdict.
Once you know your break-even, set your target at roughly 1.5 to 3 times higher. That band leaves real profit while still being aggressive enough to keep scaling. This is why a marketer at a high-margin SaaS company and one at a low-margin reseller can both be right when they disagree about what a good ROAS is.
ROAS benchmarks by platform in 2026
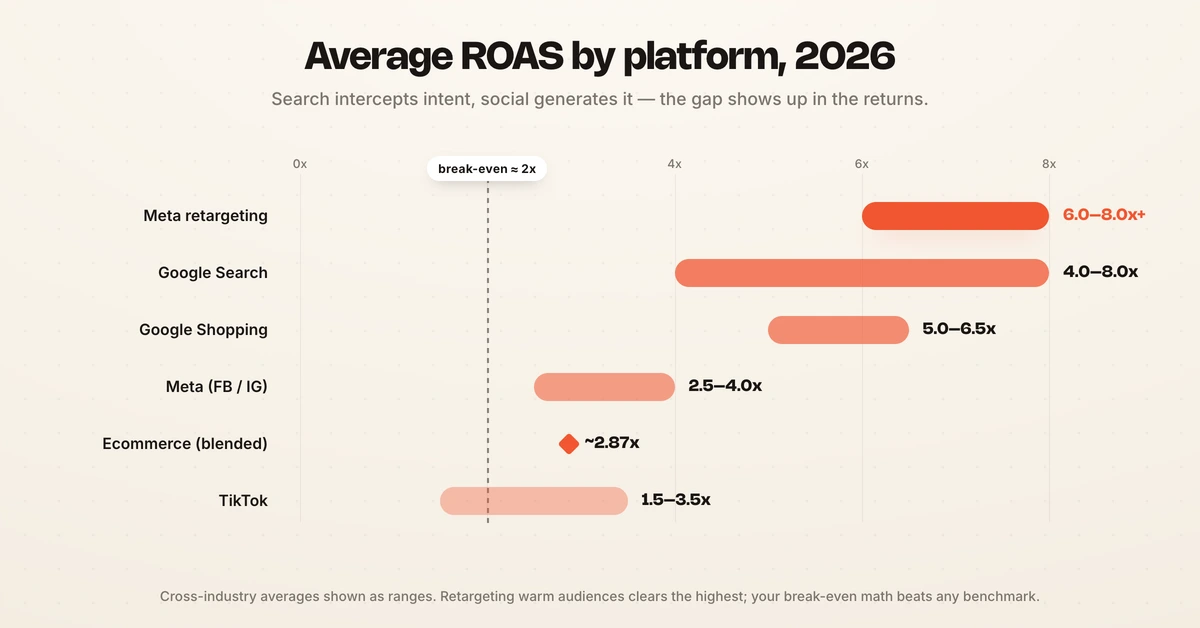
Average ROAS varies widely by platform because buyer intent differs. Search captures existing demand, while social creates it, and that gap shows up in the returns. The figures below are cross-industry averages, useful as reference points but never a substitute for your break-even math.
| Platform | Average ROAS (2026) | Why |
|---|---|---|
| Google Search | 4.0x – 8.0x | High intent; users already searching to buy |
| Google Shopping | 5.0x – 6.5x | Product-level intent with images and price |
| Meta (Facebook/Instagram) | 2.5x – 4.0x | Demand generation; interrupts, not intent |
| Meta retargeting | 6.0x – 8.0x+ | Warm audiences already familiar with the brand |
| TikTok | 1.5x – 3.5x | Newer, creative-dependent, top-of-funnel heavy |
| Ecommerce (blended) | ~2.87x | Cross-platform average across stores |
So what is a good ROAS for Google Ads? Roughly 4.0x and up on Search, because search intercepts people already looking to buy, per benchmarks compiled by WebFX. What is a good ROAS for Facebook Ads is a lower bar, 2.5x to 4.0x blended, because Meta generates demand rather than capturing it, though retargeting campaigns there routinely clear 8x by re-engaging warm audiences. TikTok trends lowest on average and depends most heavily on creative quality.
Industry matters as much as platform. Beauty and ecommerce tend to outperform, while healthcare and high-consideration B2B run lower because their sales cycles are longer.
What is a good ROAS for ecommerce specifically? The blended cross-store average sits near 2.87x, so anything clearing 3x on healthy margins is doing its job. For a full breakdown, see the deep dives on ROAS benchmarks by industry and average ROAS for ecommerce.
ROAS vs. profit: the number ROAS hides
ROAS and profit are not the same thing, and treating them as interchangeable is the most expensive mistake in paid media. ROAS is a revenue ratio, so it ignores your cost of goods, fulfillment, and returns entirely. Two campaigns with an identical 4x ROAS can produce very different profit depending on what sits underneath the revenue.
This is why break-even ROAS exists as a concept. It folds your margin back into the picture and converts a vanity ratio into a decision you can act on. A profitable ROAS is any ROAS above your break-even; an impressive-looking ROAS below break-even is still a loss.
Marketers who scale profitably watch ROAS against their break-even line, not against an industry chart. The chart tells you roughly where the field is standing. Your break-even tells you whether the next dollar of spend makes or loses money.
ROAS vs. ROI vs. ACOS
ROAS is often confused with ROI and ACOS, but each answers a different question. ROAS measures revenue per ad dollar. ROI (return on investment) measures profit relative to total cost, so it accounts for margin and is always the harder, more honest number. ACOS (advertising cost of sale) is simply the inverse of ROAS, used mainly on Amazon, where a 25% ACOS equals a 4x ROAS.
| Metric | Formula | Answers |
|---|---|---|
| ROAS | Ad revenue ÷ ad spend | How efficient is the ad spend? |
| ROI | (Profit − cost) ÷ cost | Is the whole effort profitable? |
| ACOS | Ad spend ÷ ad revenue | What share of sales went to ads? |
Use ROAS for day-to-day campaign decisions because it is fast and platform-native. Use ROI when you report to finance, because it is the number that reflects actual profit. The bridge between them is your break-even ROAS, which quietly folds margin back into the ROAS you watch every day. For the full comparison, including a worked example where a 4x ROAS ends the month at a loss, see ROAS vs ROI.
How to improve your ROAS
If your ROAS is below target, the fix is almost always creative, targeting, or landing experience, in that order of impact. Weak creative caps every campaign, no matter how sharp the targeting, because on Meta and TikTok the creative is the targeting. Testing more creative angles is the highest-impact move for most accounts, and the tools for creative ROAS optimization show which hooks and visuals actually earn the return.
Tightening the funnel comes next. Better audience selection, cleaner exclusions, and a landing page that matches the ad's promise all lift conversion rate, which flows straight through to ROAS. Small conversion-rate gains compound because they cost nothing in additional ad spend.
Automation and speed are the third lever. The faster you catch a fatiguing creative or a drifting campaign, the less spend you waste below break-even. Hawky's Performance Agent optimizes campaigns against a ROAS target across TikTok, Meta, Google, and YouTube, refreshing creative and reallocating budget with guardrails and a full audit trail, so the account stays above break-even without someone watching it all day. Its Command Center surfaces which creatives are dragging ROAS down before the spend adds up.
Frequently asked questions
What is a good ROAS?
A good ROAS is any return above your break-even point that still leaves profit, which for most businesses falls between 3:1 and 5:1. The universal 3:1 rule of thumb is only a starting reference. Your real target depends on your gross profit margin: calculate break-even ROAS as 1 divided by your margin, then aim for 1.5 to 3 times that number. Whether you phrase it as what's a good ROAS or what is good ROAS, the answer is the same: it is set by your margin, not by an industry average.
What is the average ROAS?
The average ROAS across all platforms and industries sits around 2.87:1 for ecommerce, but platform averages differ sharply. Google Ads averages 4.0x to 8.0x because it captures high-intent search, while Meta averages 2.5x to 4.0x because it generates demand rather than capturing it. TikTok trends lower at 1.5x to 3.5x and depends heavily on creative quality.
Is 3x ROAS good?
It depends entirely on your profit margin. A 3x ROAS is highly profitable for a business with 60%+ margins, where break-even sits below 1.7x, but it is a loss for a low-margin reseller at 25% margins, where break-even is 4x. Calculate your break-even ROAS first, then judge whether 3x clears it with room to spare.
What is break-even ROAS?
Break-even ROAS is the exact ratio at which ad revenue covers all your costs, calculated as 1 divided by your gross profit margin. At a 50% margin, break-even is 2x; at 25%, it is 4x. Any ROAS above your break-even is profitable, and any ROAS below it loses money regardless of how high the raw number looks.
Is a higher ROAS always better?
Not always. A very high ROAS, such as 10x, often signals under-spending rather than success, because it usually means you are only reaching your warmest, cheapest audience and refusing to scale. Efficiency and growth pull against each other, so the right ROAS balances profitable returns with the volume goals for your business that quarter.
Knowing your target is one thing; hitting it every day across platforms is another. If keeping campaigns above their break-even ROAS without babysitting the account is the problem, Hawky's Performance Agent is built for that job.
Ready to hire your first AI performance team? Book Demo