Creative Performance Reporting: How to Build Dashboards That Drive Decisions

Creative performance reporting is the practice of measuring and presenting how each ad creative drives business outcomes, organized by creative dimension rather than by campaign. A good report leads with outcome metrics like ROAS and CPA, layers in creative diagnostics like hook rate and hold rate, and lets each stakeholder drill into the creatives that matter to them. Done right, it turns raw ad data into a decision about what to scale, refresh, or kill.
Most teams report on campaigns and call it creative reporting. That hides the one variable that actually moves performance: the creative itself. This guide walks through building a creative performance dashboard that answers real questions, from the data you need to the cadence that keeps everyone aligned.
What you need before you start
Creative reporting only works when you can attribute performance to the individual creative, not just the campaign. Before building anything, get three things in place: connected ad accounts, outcome data, and creative-level tagging.
Connect every platform you run, so Meta, Google, TikTok, and YouTube data lives in one view instead of separate tabs. Pull outcome data from your CRM, analytics, or ecommerce backend, because platform-reported numbers alone over-credit the ad and hide true ROAS. Then tag creatives at the element level (hook, format, concept, angle, CTA) so you can compare like with like.
Without creative-level tagging, you are stuck reporting blended campaign averages that tell you nothing about which hook or concept won. The tagging is the foundation everything else builds on. For the metrics themselves, see how to measure ad creative performance.
Step 1: Define the questions and the stakeholders
Start with the decisions the report should drive, not the charts you want to build. A dashboard exists to answer questions: which creatives to scale, which are fatiguing, which concepts to make more of, and where budget is leaking. Write those questions down first, then design backward from them.
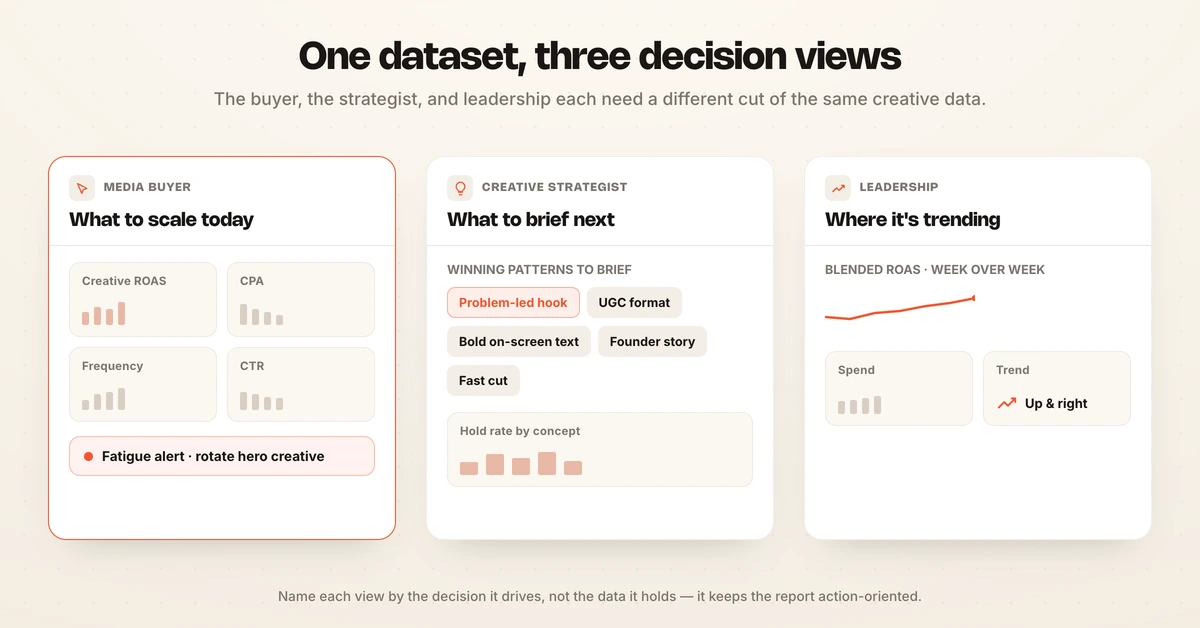
Different stakeholders need different answers from the same data. A media buyer wants creative-level ROAS and fatigue signals to act on today. A creative strategist wants concept and hook patterns to brief the next batch. Leadership wants the trend and the headline, not the row-level detail.
Map each audience to the two or three metrics they actually use, and plan a view for each. One giant dashboard that serves everyone serves no one, because the buyer drowns in creative theory and the strategist drowns in bid data.
| Stakeholder | The decision they make | Metrics they need |
|---|---|---|
| Media buyer | What to scale or refresh today | Creative ROAS, CPA, frequency, fatigue signals |
| Creative strategist | What to brief next | Hook and concept patterns, hold rate |
| Leadership | Where the account is trending | Blended ROAS, spend, week-over-week trend |
Pro tip: name each view by the decision it drives ("what to scale this week," "next creative brief"), not by the data it contains. It keeps the report action-oriented.
Step 2: Tag creatives at the element level
Element-level tagging is what turns a spreadsheet of ad names into creative intelligence. Tag each creative by the attributes that explain performance: hook style, format (static, video, carousel), concept or angle, CTA, offer, and creator type. These tags are the dimensions you will slice performance by.
The payoff is pattern detection. Once tagged, you can ask whether problem-led hooks beat product-led ones, whether UGC outperforms studio video, or which concept carries the account, instead of guessing from ad names. Patterns only emerge when the data is structured to reveal them.
Tagging by hand does not scale past a few dozen creatives, which is where AI labeling earns its place. Hawky's Creative Analysis auto-tags creatives at the hook, visual, and CTA level and scores each element, so the tagging that usually stalls a reporting program happens automatically. For the deeper method, see how to analyze creative performance.
Step 3: Build the dashboard in layers
A creative dashboard should read top to bottom from outcome to diagnosis. Lead with outcome metrics, then creative diagnostics, then the drill-down, so anyone can start at the headline and dig only as far as they need.
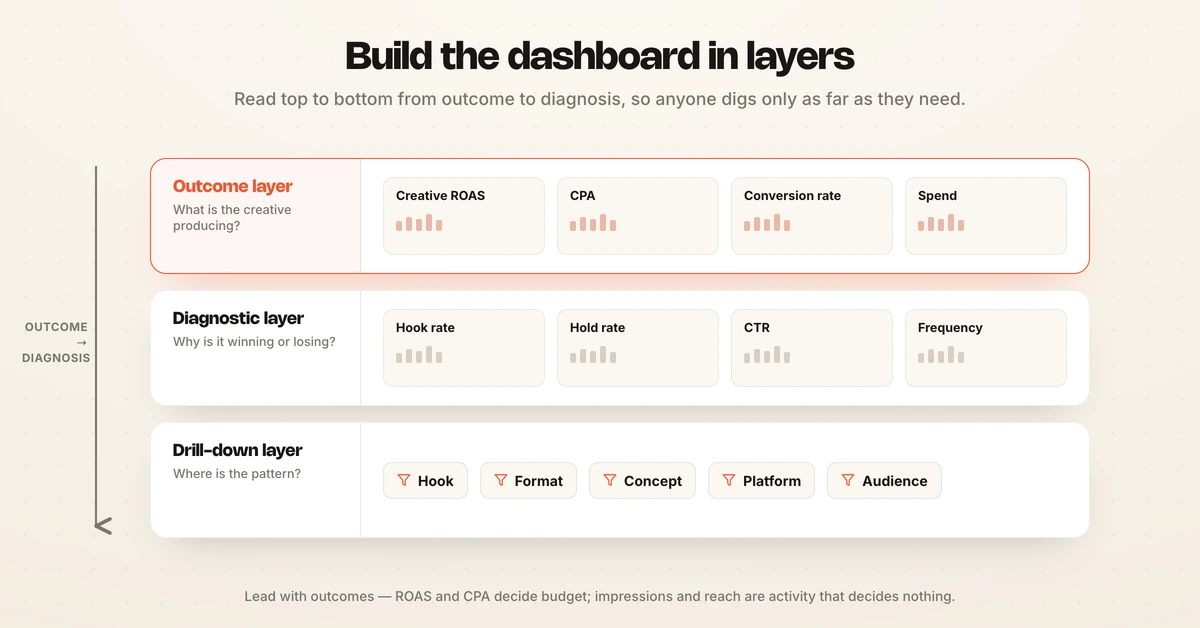
Structure it in three layers:
- Outcome layer: creative-level ROAS, CPA, conversion rate, and spend. What is the creative producing for the business?
- Diagnostic layer: hook rate, hold rate, CTR, and frequency. Why is a creative winning or losing?
- Drill-down layer: filter by creative dimension (hook, format, concept, platform, audience) to find the pattern.
Lead with outcomes, not activity. Impressions and reach are activity metrics that feel productive but decide nothing; ROAS and CPA decide budget. Use conditional formatting to flag outliers automatically, highlighting any creative performing well above or below the account mean so winners and losers surface without hunting, a design principle Improvado recommends for creative dashboards.
Step 4: Set a cadence and automate it
A report nobody opens is not reporting. Set a fixed cadence matched to how fast creative moves: a weekly creative review for active accounts, plus a monthly rollup for trends and a quarterly view for strategy. On platforms where creative fatigues in two to three weeks, weekly is the floor.
Automate delivery so the report reaches people where they work. Scheduled exports, Slack or email summaries, and shareable links keep media, creative, and leadership aligned on the same numbers without chasing an analyst. Automation is what turns reporting from a monthly scramble into a habit.
Add anomaly alerts on top of the schedule. A sudden CPA spike or a fatiguing hero creative should trigger a notification the day it happens, not surface in next month's deck. For the tools that automate this end to end, see the best creative performance reporting tools.
Step 5: Turn the report into decisions
Reporting only pays off when it changes what you do next. Every review should end with actions, not observations. Close each cycle by sorting creatives into four buckets and acting on each.
Scale the clear winners by shifting budget to them. Refresh the fatiguing creatives before their rising CPM drains the account. Codify the winning patterns into a brief so the next batch starts from evidence. Kill the persistent losers so they stop taxing your averages.
This is the difference between a dashboard that describes the past and one that changes the present. The report is not the deliverable; the decision is. Hawky's Command Center ranks creative tasks by expected impact and pushes them to the right team, so the report becomes a to-do list instead of a slide.
Common creative reporting mistakes
Most creative reporting fails in the same few ways. Avoid these:
- Reporting campaigns, not creatives. Campaign averages blend dozens of ads and hide which creative actually worked. Always report at the creative level.
- Leading with activity metrics. Impressions and reach feel like progress but drive no decision. Lead with ROAS, CPA, and conversion rate.
- Trusting platform-reported numbers alone. Each platform over-credits itself on last-click. Reconcile against actual revenue before deciding.
- No cadence. A dashboard checked once a month misses fatigue that sets in within weeks. Set a weekly creative review.
- One dashboard for everyone. Buyers, strategists, and leadership need different views. Build a view per decision.
Tools that make creative reporting easier
Several categories of tools handle different parts of this workflow, and most teams combine two or three.
- Creative analytics platforms (Motion, Triple Whale) turn creative-level data into visual reports and comparisons, strong for creative-led teams.
- Marketing data platforms (Improvado) unify many sources for cross-channel governance and custom dashboards at scale.
- Hawky goes beyond reporting: Creative Analysis auto-tags and scores every creative element, Command Center turns findings into ranked tasks, and the agents act on them with guardrails and an audit trail. The Man Company doubled creative performance and cut iteration cycles 50% working this way.
For a full comparison, see the best tools to evaluate creative performance.
Frequently asked questions
How do you report on creative performance?
Report on creative performance by measuring outcomes at the individual creative level, not the campaign level. Connect your ad platforms and outcome data, tag each creative by element (hook, format, concept, CTA), then build a dashboard that leads with outcome metrics like ROAS and CPA, layers in diagnostics like hook rate, and lets you drill down by creative dimension. Set a weekly cadence and end each review with decisions to scale, refresh, or kill.
What goes in a creative performance dashboard?
A creative performance dashboard has three layers: outcome metrics (creative-level ROAS, CPA, conversion rate, spend), creative diagnostics (hook rate, hold rate, CTR, frequency), and a drill-down that filters by creative dimension like hook, format, concept, platform, and audience. Lead with outcomes, flag outliers with conditional formatting, and build a separate view for each stakeholder so buyers, strategists, and leadership each see what they need.
How do you track creative results?
Track creative results by attributing performance to each individual creative through element-level tagging, then monitoring both outcome metrics and creative diagnostics over time. Tag every creative by hook, format, concept, and CTA so you can spot which patterns win, reconcile platform data against real revenue, and watch for fatigue as frequency rises and CTR falls. Automated dashboards and alerts keep the tracking continuous rather than a monthly snapshot.
What is the difference between creative reporting and creative analysis?
Creative reporting presents what happened, showing which creatives drove which outcomes in a structured, shareable view. Creative analysis goes deeper to explain why, breaking a creative down to the element level to identify which hook, visual, or CTA drove the result. Reporting keeps stakeholders aligned on performance; analysis produces the insight that informs the next creative. Strong programs do both.
How often should you report on creative performance?
Report on active accounts weekly, because creative fatigues within two to three weeks on platforms like Meta and TikTok, so a monthly cadence misses decay you could have caught. Layer a monthly rollup for trends and a quarterly view for strategy on top of the weekly review. Add real-time anomaly alerts so a sudden CPA spike or a fatiguing hero creative triggers action the day it happens.
If turning creative data into a clear report and then into the actual decisions to scale and refresh is the problem, Hawky's Creative Analysis and Command Center are built for that job.
Ready to hire your first AI performance team? Book Demo