How to Measure Ad Creative Performance: The Metrics That Matter
The metrics that measure ad creative performance are hook rate, hold rate, click-through rate, cost per action, and ROAS, read as a diagnostic sequence rather than in isolation. Hook rate shows if the creative stops the scroll, hold rate shows if it keeps attention, CTR shows if it earns the click, and CPA and ROAS show the business result. Together they tell you not just whether a creative worked, but exactly where it won or lost.
Most teams judge creative on CTR alone, which hides why an ad succeeded or failed. This guide covers the creative-level metrics that actually diagnose performance, their 2026 benchmarks, and how to read them as a funnel so you can fix the specific point where a creative breaks down.
What metrics measure ad creative performance?
Ad creative performance is measured by a small set of metrics that separate engagement from business impact. Engagement metrics (hook rate, hold rate, and CTR) tell you how compelling the creative is, while outcome metrics (CPA and ROAS) tell you what that engagement produced for the business. You need both, because a captivating ad that does not convert and a converting ad you cannot explain are each half-blind.
| Metric | What it measures | Type |
|---|---|---|
| Hook rate (thumbstop) | Does the first 3 seconds stop the scroll? | Engagement |
| Hold rate | Does it keep viewers watching? | Engagement |
| Click-through rate (CTR) | Does it earn the click? | Engagement |
| Cost per action (CPA) | What does a conversion cost? | Outcome |
| ROAS | What revenue per ad dollar? | Outcome |
The metric everyone over-relies on is CTR, and on its own it is misleading. A high CTR with weak hold rate means the ad baited clicks it did not earn, and a strong CTR with poor ROAS means the clicks did not convert. Reading these together is what turns numbers into decisions. For the broader discipline, see ad creative analysis.
The creative diagnostic funnel: hook, hold, click, convert
The most useful way to read creative metrics is as a funnel, because each stage isolates a different failure point. A viewer has to stop, stay, click, and convert, and each metric maps to one of those steps. When performance drops, this sequence tells you which step broke.
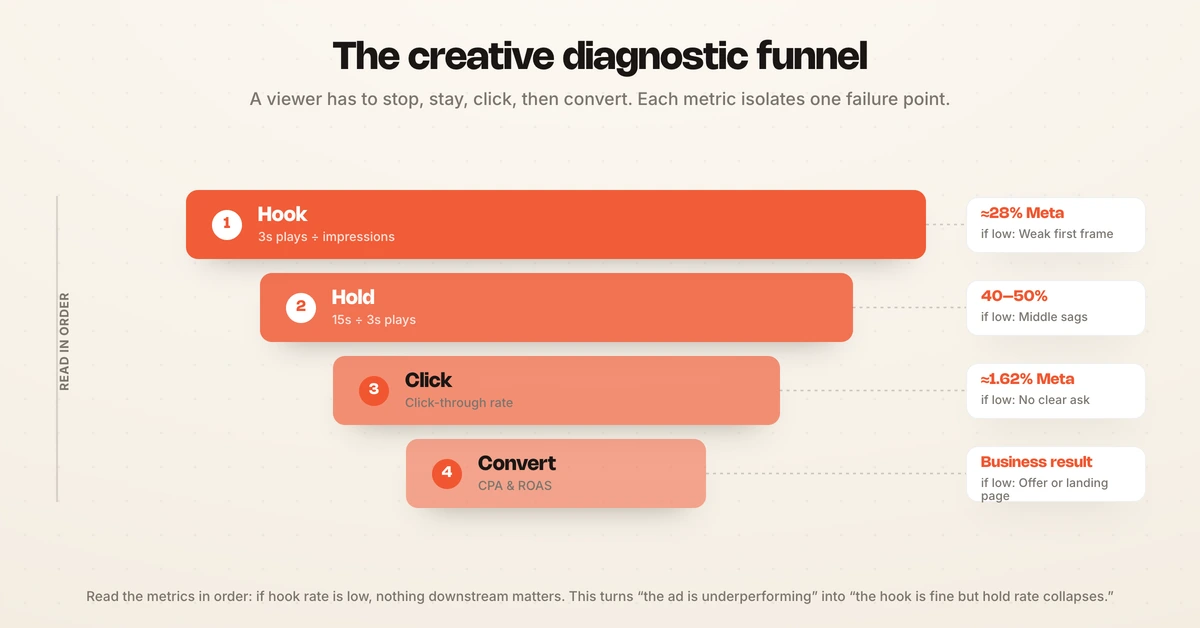
Read the metrics in order:
- Hook rate first: if it is low, the first frame is not stopping the scroll, so nothing downstream matters.
- Hold rate next: if hook rate is fine but hold rate is low, the opening grabbed attention but the ad did not earn it.
- CTR third: if hook and hold are fine but CTR is low, the creative held viewers but did not make a clear case or ask.
- CPA and ROAS last: if engagement is strong but these are weak, the problem is the offer or landing page, not the creative.
This sequence is the difference between diagnosing and guessing. Instead of "the ad is underperforming," you get "the hook is fine but hold rate collapses at 8 seconds," which tells you exactly what to fix. Layering this on top of a creative testing framework is how teams improve systematically.
Hook rate: the first metric to check
Hook rate, also called thumbstop rate, measures how well your opening stops the scroll, calculated as 3-second video plays divided by impressions, times 100. It is the first gate every creative has to pass, because an ad that does not earn the first three seconds never gets a chance at anything else.
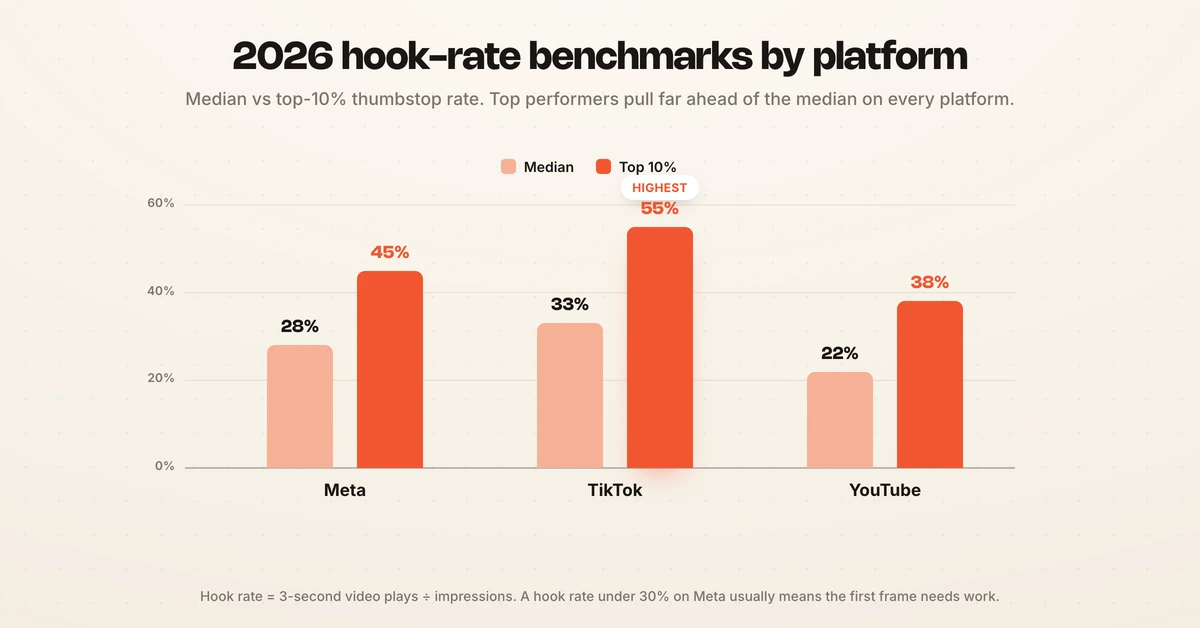
Hook rate benchmarks vary by platform. In 2026, median hook rates are roughly 28% on Meta, 33% on TikTok, and 22% on YouTube, while top 10% performers hit 45%, 55%, and 38% respectively, per Motion. A hook rate under 30% on Meta usually signals the creative needs work at the very start.
Because the hook carries so much weight, it is the highest-impact thing to test and fix. Swapping the first three seconds can transform a creative's entire performance, which is why hook rate leads the diagnostic funnel. For a closer look, see the hook rate guide.
Hold rate: does the creative keep attention?
Hold rate measures how many people who stopped to watch actually kept watching, calculated as 15-second video plays divided by 3-second video plays, times 100. It tells you whether the body of the ad earns the attention the hook captured, which is where many creatives quietly fail.
Average hold rates run 40% to 50%, with anything above 60% considered strong, per Billo. A strong hook with a weak hold rate is a specific, fixable diagnosis: the opening promised something the rest of the ad did not deliver, so viewers dropped off. The fix is pacing and payoff in the middle of the creative, not a new hook.
Reading hook and hold together locates the drop-off precisely. A creative with a 40% hook rate and a 65% hold rate has a first-frame problem, while one with a 30% hook and a 35% hold is losing people at both stages and needs a rework, not a tweak.
What is a good creative CTR?
A good creative CTR depends on platform and format, but video ad CTR in 2026 averages around 1.62% on Meta, 0.84% on TikTok, and 0.42% on YouTube in-stream, per Benly. CTR sits third in the diagnostic funnel because it only matters once the creative has stopped and held the viewer. A click is the creative asking for action and getting it.
Read CTR against hold rate, not alone. High watch-through with a low CTR usually means the ad entertained but never made a clear case or a strong ask, so viewers enjoyed it and moved on. That is a call-to-action and messaging problem, not an attention problem, and it is invisible if you only look at CTR. For platform CTR benchmarks across formats, see what is a good CTR.
The same blind spot shows up on the organic side, where a brand leader counts saves as the signal CTR and view rates miss.
Velocity podcast
“People bookmarking, small metric but huge. We look at CTR and you look at all of those view rates. But what you need to look at additionally: what did the person do?”
Creative metrics vs account metrics
The distinction that unlocks everything is measuring at the creative level, not just the account level. Account metrics tell you the campaign's overall CTR or ROAS, which is useful for reporting but useless for improving creative, because it blends dozens of ads into one number. Creative-level metrics attribute performance to the specific ad that produced it.
Most teams fail exactly here. Without tying each number back to the individual creative that generated it, you cannot tell which hook, concept, or format is driving results, so you optimize blind. The deepest performance gains come from this granularity: knowing that concept A holds attention while concept B converts, then building the next creative from both.
This is what element-level analysis provides. Hawky's Creative Analysis breaks performance down to the hook, visual, and CTA of each creative, so you see why an ad worked rather than just that it did, and the Creative Agent builds the next batch from those winning elements. For a creative team's view, see paid ad analytics for creative teams.
Frequently asked questions
What metrics measure ad creative performance?
The core metrics are hook rate (thumbstop), hold rate, click-through rate, cost per action, and ROAS. Hook rate, hold rate, and CTR measure how engaging the creative is, while CPA and ROAS measure the business result. Read together as a funnel, they show not just whether a creative worked but exactly which stage (stopping, holding, clicking, or converting) succeeded or failed.
What is a good creative CTR?
A good creative CTR depends on platform and format. Video ad CTR in 2026 averages around 1.62% on Meta, 0.84% on TikTok, and 0.42% on YouTube in-stream, with static formats often running higher on Meta. CTR should be read against hold rate: a high watch-through with a low CTR usually means the creative entertained but did not make a strong enough ask or case.
Which KPIs matter most for creative?
Hook rate matters most as the first gate, because a creative that does not stop the scroll never gets a chance at anything else. After that, hold rate and CTR diagnose whether the ad keeps attention and earns the click, while CPA and ROAS confirm the business impact. The key is reading them as a sequence, since each isolates a different failure point.
What is a good hook rate?
A good hook rate in 2026 is around 28% or higher on Meta, 33% on TikTok, and 22% on YouTube, with top performers reaching 45% to 55%. Hook rate is calculated as 3-second video plays divided by impressions. Anything below 30% on Meta usually means the first frame is not stopping the scroll and the opening needs to be reworked.
How do you measure creative performance at the creative level?
Measure at the creative level by attributing each metric to the specific ad that produced it, rather than reading blended account averages. Track hook rate, hold rate, CTR, CPA, and ROAS per creative so you can compare concepts directly. This requires creative-level tagging or an analysis tool, since platform dashboards often report at the campaign level and hide which individual creative is driving the result.
If tying performance back to each creative and seeing which element drives it is the problem, Hawky's Creative Analysis and Creative Agent are built for that job.
Ready to hire your first AI performance team? Book Demo