What Is a Good CTR? Benchmarks by Platform and Industry
A good CTR is 3% to 5% or higher on Google Search, 1.5% to 3% on Meta, and above 0.5% on Google Display. Click-through rate always depends on the platform and the intent behind the click, so there is no single number that means "good" everywhere. A 1% CTR is a warning sign on Google Search and a solid result on the Display network.
Click-through rate is the fastest read on whether your ad earns attention. It will not tell you if a campaign is profitable, but a CTR far below benchmark almost always points to a creative or targeting problem you can fix. This guide gives you real 2026 benchmarks by platform and industry, and shows you how to read them.
What is CTR?
CTR (click-through rate) is the percentage of people who click your ad after seeing it, calculated as clicks divided by impressions. If your ad is shown 10,000 times and gets 200 clicks, your CTR is 2%. It measures how compelling your ad is at the moment of exposure.
CTR is an engagement metric, not a revenue metric. A high CTR means your creative and targeting are earning the click, but it says nothing about what happens after, which is the job of conversion rate and ROAS. The two can even move in opposite directions when a clickbait hook pulls clicks that never convert. For a full definition, see the CTR glossary entry.
The metric matters because it is an early signal. Long before a campaign accumulates enough conversions to judge ROAS, CTR tells you whether the market responds to your ad, which makes it the first number performance marketers check on a new creative.
How to calculate CTR (with an example)
CTR is calculated by dividing the number of clicks by the number of impressions, then multiplying by 100 to get a percentage. The formula is clicks divided by impressions times 100.
Take a real case. A fashion brand runs a Meta ad that serves 50,000 impressions and collects 1,100 clicks over a week. Divide 1,100 by 50,000 to get 0.022, then multiply by 100 for a 2.2% CTR. Against the Meta average of roughly 1.5% to 2%, that ad is performing above benchmark.
Platforms report two versions on Meta, and the difference trips people up. All-clicks CTR counts every click including likes and shares, while link CTR counts only clicks to your destination. Link CTR is the more honest number for performance, and it runs lower, often around 1%, so always confirm which one you are reading before comparing to a benchmark.
What counts as a good CTR by platform?
A good CTR clears the average for the platform and objective you are running. Search rewards intent, so its benchmarks are far higher than social or display, where you interrupt someone doing something else. The table below sets the 2026 reference points.
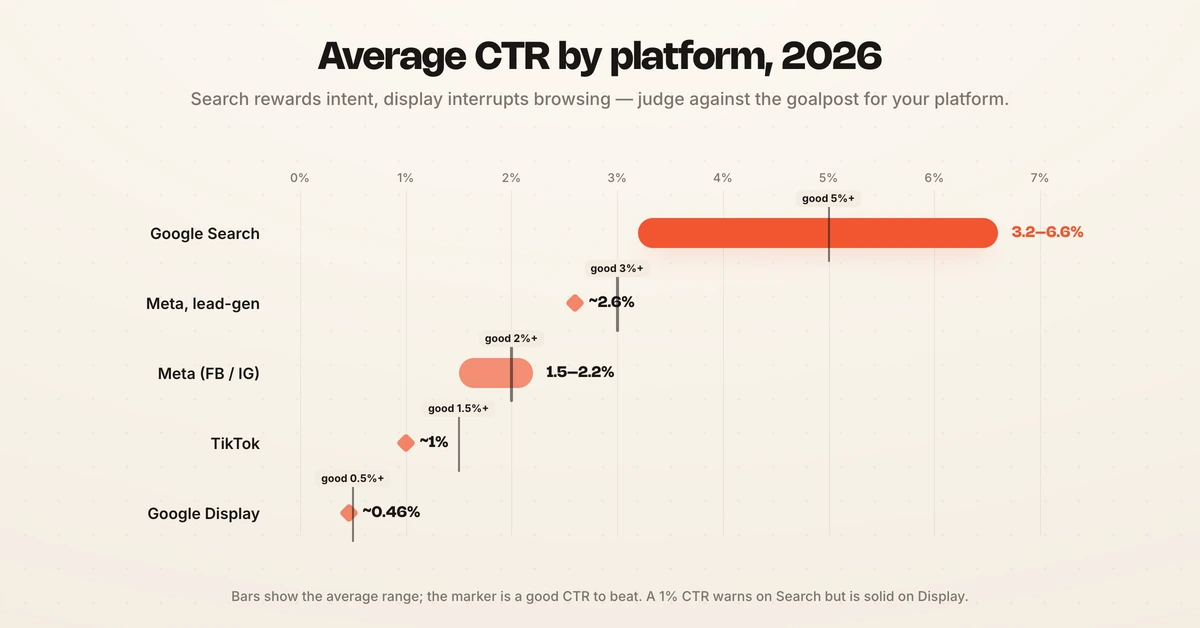
| Platform | Average CTR | Good CTR |
|---|---|---|
| Google Search | 3.2% – 6.6% | 5%+ |
| Google Display | ~0.46% | 0.5% – 1%+ |
| Meta (Facebook/Instagram) | 1.5% – 2.2% | 2% – 3%+ |
| Meta, lead-gen objective | ~2.6% | 3%+ |
| TikTok | ~1% | 1.5%+ |
Google Search CTRs run highest because users are actively searching, per benchmarks compiled by WebFX and LocaliQ. Meta sits in the low single digits because it generates demand rather than capturing it. Google Display trails everything because banner ads interrupt browsing, so anything above 0.5% is healthy.
CTR benchmarks by industry
Industry shifts the benchmark as much as platform does. High-emotion, visual categories earn clicks easily, while regulated or high-consideration ones do not. On Meta, art and home decor lead near 2.9% while healthcare and finance sit below 1%, per Triple Whale industry data.
On Google Search, arts and entertainment and travel top the charts above 11%, while B2B and legal run in the 2% to 5% band despite high intent, because their queries are narrower and more competitive. The pattern holds across platforms: the more visual and impulsive the category, the higher the CTR you should expect.
For platform-specific breakdowns with full industry tables, see Facebook Ads benchmarks by industry and Google Ads benchmarks by industry. Judge your CTR against your own industry row, not the cross-industry average, which blends categories that behave nothing alike.
Why a good CTR lowers what you pay
CTR does more than measure engagement; on the major platforms it directly affects your costs. On Google Ads, CTR is the largest input into Quality Score, the 1-to-10 rating Google assigns each keyword. A higher Quality Score lowers your cost per click and can lift your ad rank, so a strong CTR literally buys cheaper clicks and better positions.
The mechanism is straightforward. Google wants to show ads people click, because clicks are how it earns revenue, so it rewards high-CTR ads with a discount and penalizes low-CTR ones with higher costs. Two advertisers bidding the same amount can pay very different prices per click based on CTR alone. Improving a weak CTR is often the fastest way to cut CPC without touching your bids.
Meta runs a similar logic through its ad auction and relevance signals. Ads that earn engagement are treated as higher quality and win more impressions at a lower CPM, while ads the audience ignores get throttled and grow expensive. On both platforms, CTR is not just a scoreboard number; it is a lever on efficiency, which is why chronically low CTR quietly inflates your whole cost structure.
This cost link is also why creative fatigue hurts twice. As a creative tires, CTR drops, and the falling CTR pushes your CPC and CPM up at the same time, so a fatigued ad costs more to show and returns less. Catching that decline early protects both performance and price.
CTR vs. conversion rate: why a high CTR can mislead
CTR and conversion rate measure different stages, and optimizing for one can hurt the other. CTR measures the click; conversion rate measures what happens after the click. An ad can win the click with a bold hook and then lose the sale because the landing page does not deliver on the promise.
This is why CTR alone is a trap. A curiosity-gap headline can spike CTR while tanking conversion rate, burning budget on clicks that bounce. The healthiest accounts watch CTR and conversion rate together, because a strong ad earns the click and sets an accurate expectation the landing page can fulfill.
Read a low CTR and a low conversion rate as a creative or offer problem. Read a high CTR with a low conversion rate as a mismatch between the ad's promise and the landing experience. The pairing tells you where the leak is far faster than either number alone.
How to improve your CTR
If your CTR is below benchmark, creative is the first and biggest lever, especially on Meta and TikTok where the creative is the ad. A stronger hook in the first second, a clearer value proposition, and a format native to the platform lift CTR more than any targeting tweak. Test several distinct creative angles rather than minor variations.
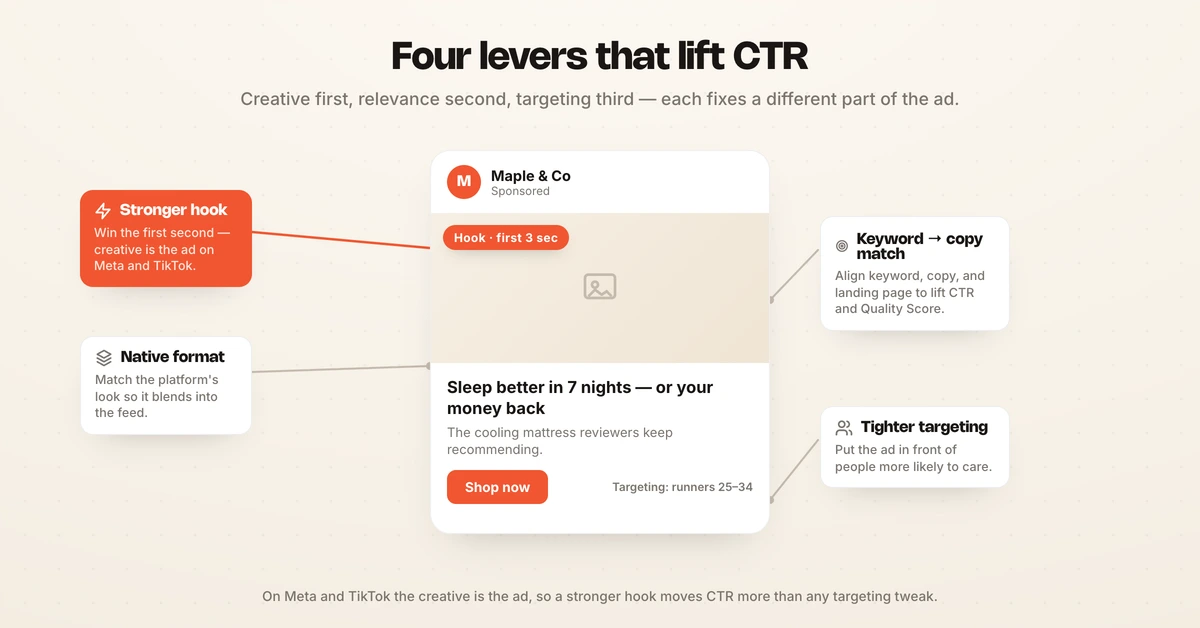
Relevance is the second lever. On Google Search, tightening the match between keyword, ad copy, and landing page raises both CTR and Quality Score, which lowers your cost per click at the same time. On social, sharper audience targeting puts the ad in front of people more likely to care.
Element-level analysis is what turns this from guesswork into a system. Hawky's Creative Analysis breaks down performance at the hook, visual, and CTA level so you can see which element is dragging CTR down, and the Performance Agent tests and refreshes creative against your target across Meta, Google, TikTok, and YouTube with guardrails and an audit trail. Catching a fading CTR early is the difference between a quick refresh and weeks of wasted spend.
Frequently asked questions
What is a good CTR?
A good CTR depends on the platform: 5% or higher on Google Search, 2% to 3% or higher on Meta, and above 0.5% on Google Display. There is no universal number because search captures intent while social and display interrupt attention. Always compare your CTR to the average for your specific platform, objective, and industry rather than a single global figure.
What is the average CTR for ads?
Average CTR in 2026 is roughly 3.2% to 6.6% on Google Search, 1.5% to 2.2% on Meta, about 0.46% on Google Display, and around 1% on TikTok. Search runs highest because users are actively looking to buy, while display runs lowest because banners interrupt browsing. These are cross-industry averages, so your own benchmark shifts with your category.
What is a good CTR by industry?
CTR varies widely by industry within each platform. On Meta, visual categories like art, home decor, and fashion clear 2.8% or more, while healthcare and finance sit below 1%. On Google Search, arts, entertainment, and travel exceed 11%, while B2B and legal run 2% to 5%. Judge your performance against your own industry row, not the blended average.
Is a higher CTR always better?
Not always. A very high CTR paired with a low conversion rate usually means the ad over-promises and the landing page under-delivers, so you pay for clicks that bounce. CTR is an engagement signal, not a profit signal. The goal is a strong CTR that also brings qualified clicks, which show up as a healthy conversion rate and ROAS.
What causes a low CTR?
A low CTR is almost always a creative or relevance problem. Weak hooks, generic visuals, poor ad-to-audience fit, and creative fatigue are the usual causes. On Google Search, a low CTR often signals a mismatch between the keyword, the ad copy, and the searcher's intent. Refreshing creative and tightening targeting are the fastest fixes.
If spotting which creative element is dragging your CTR down and refreshing it before the spend adds up is the problem, Hawky's Creative Agent and Performance Agent are built for that job.
Ready to hire your first AI performance team? Book Demo