Google Ads Benchmarks by Industry (2026 CTR, CPC, CVR, CPA Data)
Google Ads benchmarks give you a reference point for how your Search account should perform against others in your industry. In 2026, the all-industry averages on the Google Ads Search Network are a 6.64% click-through rate, an 8.18% conversion rate, a $5.42 average cost per click, and a $66.69 average cost per lead, according to LocaliQ's analysis of more than 13,000 US campaigns.
Those blended numbers hide enormous variation between industries. This guide breaks down average CTR, conversion rate, CPC, and CPA by industry on Search, then shows how to turn a benchmark gap into an actual change in your account.
Overall Google Ads benchmarks in 2026
The most-cited source for account-level Search benchmarks is the LocaliQ 2026 report, published from WordStream data covering April 2025 through March 2026. It aggregates over 13,000 US-based Search campaigns across 23 industries and reports four core metrics: click-through rate, cost per click, conversion rate, and cost per lead.
Here are the all-industry averages you can use as a starting line before you narrow down to your vertical.
| Metric | 2026 all-industry average |
|---|---|
| Average CTR | 6.64% |
| Average conversion rate (CVR) | 8.18% |
| Average CPC | $5.42 |
| Average cost per lead (CPL/CPA) | $66.69 |
Source: LocaliQ 2026 Search Advertising Benchmarks. WordStream's 2026 report publishes the same underlying dataset.
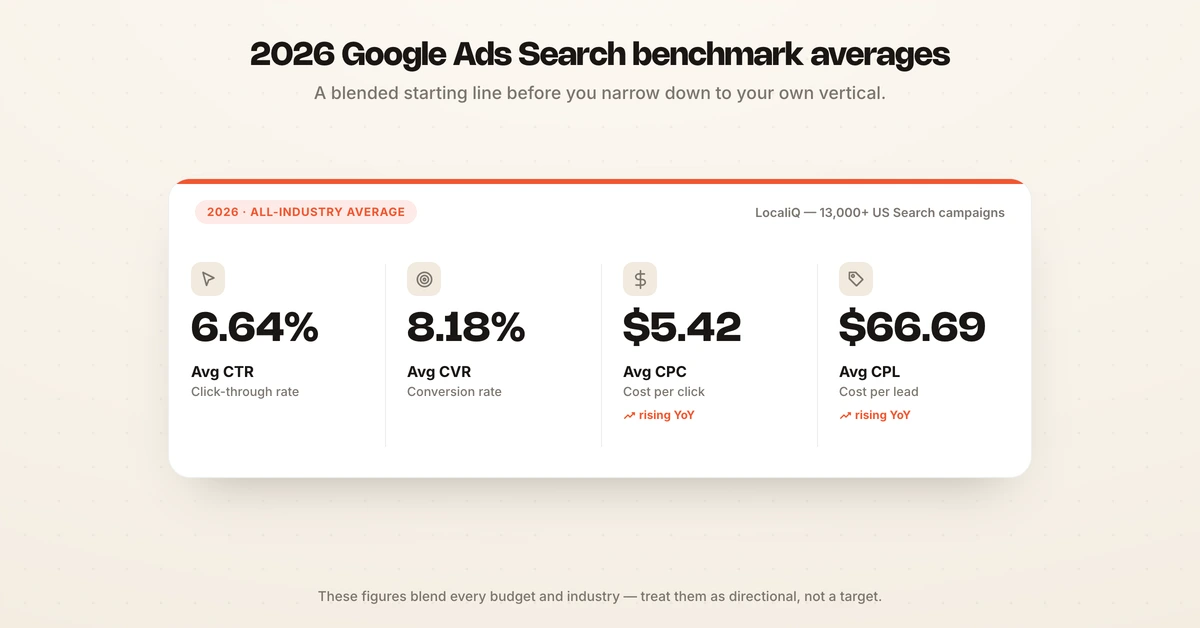
One caveat worth stating early. These figures blend Google Ads and Microsoft Ads Search across every budget size and maturity level, so treat them as directional. Your own trailing trend is a better yardstick than any average, and the industry cut below matters far more than the blended line.
Google Ads benchmarks by industry (2026)
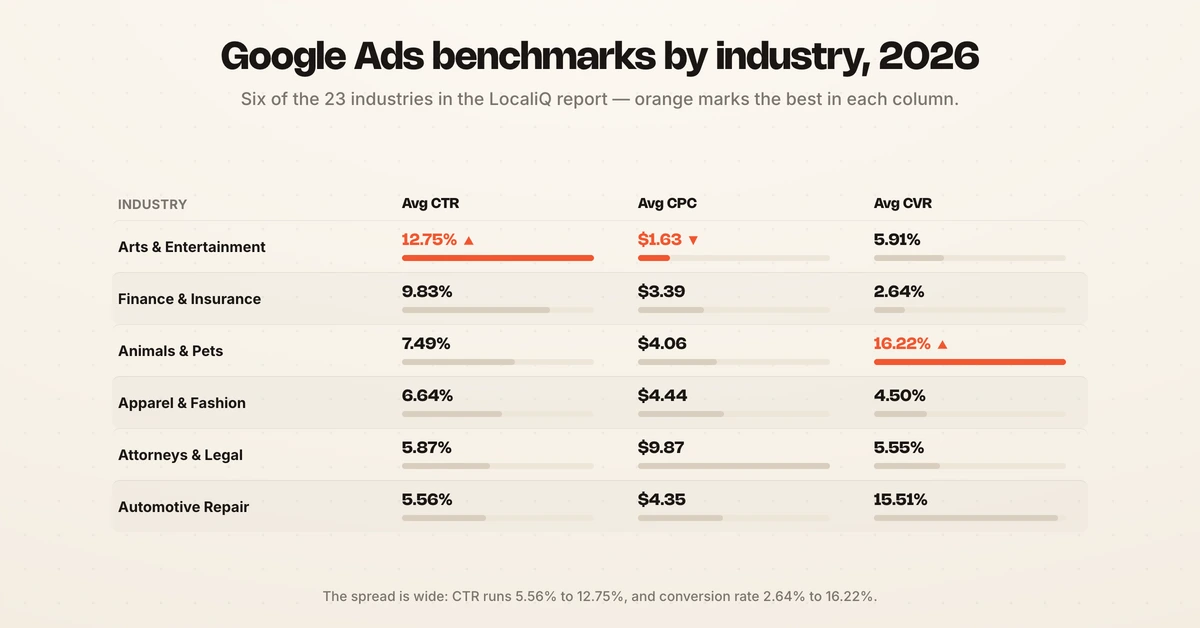
The table below is the core data asset: average CTR, CPC, conversion rate, and cost per lead for each of the 23 industries in the LocaliQ 2026 report. Find your row first, then read the rest of this guide against those numbers rather than the all-industry averages.
| Industry | Avg CTR | Avg CPC | Avg CVR | Avg CPL |
|---|---|---|---|---|
| Animals and Pets | 7.49% | $4.06 | 16.22% | $31.50 |
| Apparel, Fashion and Jewelry | 6.64% | $4.44 | 4.50% | $97.51 |
| Arts and Entertainment | 12.75% | $1.63 | 5.91% | $26.84 |
| Attorneys and Legal Services | 5.87% | $9.87 | 5.55% | $131.63 |
| Automotive (For Sale) | 8.28% | $2.27 | 6.01% | $44.26 |
| Automotive (Repair and Service) | 5.56% | $4.35 | 15.51% | $29.96 |
| Beauty and Personal Care | 6.75% | $4.62 | 10.35% | $39.25 |
| Business Services | 6.10% | $5.87 | 4.85% | $93.69 |
| Career and Employment | 5.88% | $5.81 | 3.05% | $67.36 |
| Dentists and Dental Services | 5.66% | $8.00 | 10.67% | $72.97 |
| Education and Instruction | 7.56% | $4.81 | 13.14% | $77.48 |
| Finance and Insurance | 9.83% | $3.39 | 2.64% | $74.44 |
| Health and Fitness | 5.81% | $6.17 | 6.94% | $67.36 |
| Home and Home Improvement | 6.47% | $8.33 | 8.05% | $90.92 |
| Personal Services | 7.16% | $7.17 | 12.34% | $54.60 |
| Physicians and Surgeons | 6.61% | $4.76 | 12.43% | $40.04 |
| Real Estate | 7.61% | $3.22 | 3.70% | $102.51 |
| Restaurants and Food | 6.83% | $2.05 | 8.05% | $30.57 |
| Shopping, Collectibles and Gifts | 8.28% | $4.14 | 4.01% | $49.40 |
| Sports and Recreation | 8.75% | $2.77 | 7.69% | $44.26 |
| Travel | 9.32% | $2.14 | 5.83% | $44.70 |
Source: LocaliQ 2026 Search Advertising Benchmarks.
CTR by industry
Click-through rate measures how often people who see your ad click it, and it is the clearest signal of ad relevance and message match. The 2026 average CTR is 6.64%, but the spread is wide. Arts and Entertainment leads at 12.75%, Travel and Finance and Insurance clear 9%, while Automotive Repair sits near the bottom at 5.56%.
High-intent, informational queries tend to earn stronger CTRs, while crowded commercial verticals compress it. If your CTR trails your industry line, the fix usually lives in ad copy, keyword-to-headline match, and extensions rather than bids.
Conversion rate by industry
Conversion rate is the share of clicks that turn into a lead or sale, and it is where industries diverge most. The all-industry average is 8.18%, but Animals and Pets converts at 16.22% and Automotive Repair at 15.51%, while Finance and Insurance sits at just 2.64% and Apparel at 4.50%.
A low conversion rate is not always a problem if your product is considered or high-ticket. Read your number against your own vertical, and when it lags, look first at landing page speed, form friction, and offer clarity.
CPC by industry
Cost per click is set by auction competition and commercial intent. The 2026 average CPC is $5.42, but Attorneys and Legal Services pay $9.87 and Home and Home Improvement $8.33, while Arts and Entertainment clicks cost $1.63 and Restaurants and Food $2.05.
A rising CPC is not automatically bad if your conversion rate and revenue keep pace. For more on what drives these costs, see our breakdown of what Google Ads actually costs.
CPA and cost per lead by industry
Cost per lead, often used interchangeably with CPA at the account level, is the bottom-line efficiency metric. The 2026 average CPL is $66.69. Attorneys and Legal Services lead at $131.63, with Real Estate at $102.51 and Apparel at $97.51, while Arts and Entertainment ($26.84) and Automotive Repair ($29.96) sit far below the mean.
Because CPL is a function of both CPC and conversion rate, it is the metric to watch when you want a single number for account health. If you also run ecommerce or return-driven campaigns, pair this with ROAS benchmarks by industry.
What is a good CTR for Google Ads?
A good CTR is anything at or above your industry line, using the 6.64% all-industry average only as a rough floor. If you run legal or dental campaigns where the average CTR sits in the mid-5% range, a 6% CTR is strong. If you run travel or finance where averages exceed 9%, that same 6% signals a relevance problem.
The point is to benchmark against your vertical, not the blended number. A CTR meaningfully below your industry average usually means your ads are not matching search intent tightly enough.
What is a good conversion rate for Google Ads?
A good conversion rate is one that meets or beats the 8.18% average for your specific industry. High-conversion verticals like Animals and Pets and Automotive Repair clear 15%, so a 6% rate there would be weak, while in Finance and Insurance a 3% rate is right on the industry line.
Conversion rate is downstream of your landing page and offer more than your bids. When it lags, audit page load time, form length, mobile experience, and whether the ad promise matches the page.
What is a good CPC on Google Ads?
A good CPC is one below your industry average while holding your target conversion rate and CPA. The $5.42 average is a reference, but paying $9 per click in legal is normal while paying $9 in restaurants would be a red flag.
Chasing the lowest possible CPC is the wrong goal. A slightly higher CPC that lands on higher-intent traffic and a better conversion rate produces a lower cost per lead, which is what actually matters.
How to use Google Ads benchmarks
Benchmarks are a diagnostic starting point, not a scorecard. Find your industry row, compare each of your four metrics against it, and flag the largest gap. That gap tells you which lever to pull first: CTR gaps point to ad copy and relevance, conversion gaps point to landing pages, and CPC gaps point to auction strategy and keyword selection.
The trap is treating benchmarks as targets and stopping there. Knowing you sit 20% below your industry conversion rate is only useful if you then find the campaigns and keywords dragging you down and change them. Your own historical trend is a more honest baseline than any external average, because it controls for your budget, geography, and account maturity.
Track your account against benchmarks with Hawky's Command Center
Benchmarks tell you where you stand. They do not tell you what to do about the gap, and by the time a monthly report surfaces the problem, you have already spent against it. This is the difference between knowing your CTR is below industry average and having something act on it.
Hawky is an agentic performance marketing platform, and its Command Center is the unified view where you track your account against these benchmarks in real time and see what to do next. Instead of stitching together a benchmark report and a dashboard, you see your CTR, conversion rate, CPC, and CPA against your industry line in one place, with the specific campaigns behind each gap surfaced for you.
Where the Command Center shows the gap, the Performance Agent acts on it, adjusting bids, budgets, and targeting toward your goals rather than waiting for a manual weekly review. Across 200+ customers, Hawky has driven a +25% average ROAS lift in the first 90 days. You can see how it fits your spend on the pricing page.
Frequently asked questions
What is a good CTR for Google Ads?
A good click-through rate on Google Ads Search is at or above the 2026 all-industry average of 6.64%, but the honest benchmark is your own industry. Arts and Entertainment averages 12.75% while Attorneys and Legal Services average 5.87%, so compare against your vertical rather than the blended figure.
What is the average conversion rate on Google Ads?
The average conversion rate on Google Ads Search across all industries is 8.18% in 2026, based on LocaliQ's analysis of more than 13,000 US campaigns. It ranges from 2.64% in Finance and Insurance to 16.22% in Animals and Pets, so a rate at or above your industry line is a reasonable target.
What is a good CPC on Google Ads?
The average CPC on Google Ads Search is $5.42 across all industries in 2026. A good CPC is one below your industry average that still holds your target conversion rate and cost per acquisition, since low-cost verticals like Arts and Entertainment average $1.63 while legal reaches $9.87.
How much does Google Ads cost per lead in 2026?
The average cost per lead on Google Ads Search is $66.69 across all industries in 2026. It ranges from around $26.84 in Arts and Entertainment to $131.63 in Attorneys and Legal Services, so your target should sit within your industry range and your allowable cost of acquisition.
Are Google Ads benchmarks reliable for my account?
Benchmarks are directional reference points, not fixed targets. They aggregate thousands of accounts across budgets, geographies, and maturity levels, so your own historical trend matters more than a blended average. Use industry benchmarks to spot large gaps, then diagnose the specific campaigns, keywords, and landing pages behind them.
How often do Google Ads benchmarks change?
Major providers like LocaliQ and WordStream refresh their industry benchmarks annually, using a rolling twelve months of campaign data. Costs have trended upward year over year, and the 2026 report covers campaigns from April 2025 through March 2026, so always check for a current-year report rather than relying on figures more than a year old.
If closing the gap between where your Google Ads account stands and where it should be is a job you keep pushing to next week, Hawky's Command Center is built for that job.
Ready to hire your first AI performance team? Book Demo