Facebook Ads Benchmarks by Industry (2026 Data)
Facebook ads benchmarks give you the average CTR, CPC, conversion rate, and CPM that other advertisers in your industry are hitting on Meta, so you can tell whether your account is ahead of the pack or bleeding budget. For 2026 planning, the most reliable public numbers come from WordStream's 2025 benchmark study: a $0.70 average CPC and 1.71% CTR for traffic campaigns, and a 7.72% conversion rate for lead generation.
Benchmarks tell you where you stand. They do not tell you what to do about the gap. This guide gives you the full sourced numbers by industry, then shows how to turn a benchmark comparison into action.
Facebook ads benchmarks: the overall averages
Before you drill into your vertical, anchor on the platform-wide numbers. These are the medians every account is measured against.
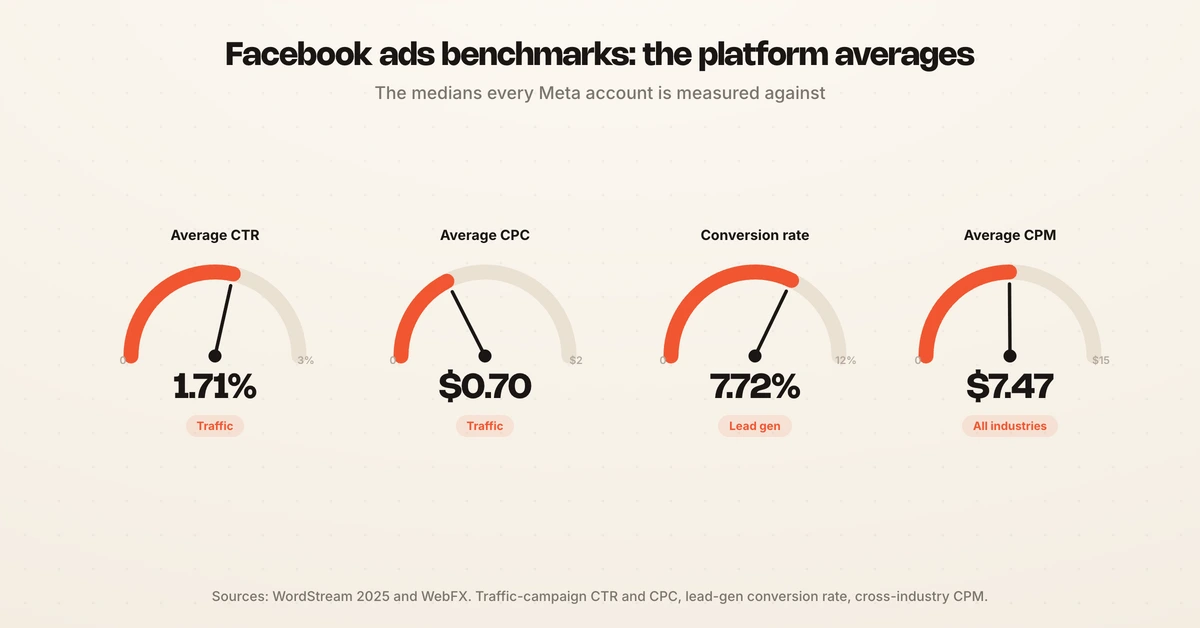
| Metric | Traffic campaigns | Lead generation campaigns |
|---|---|---|
| Average CTR | 1.71% | 2.59% |
| Average CPC | $0.70 | $1.92 |
| Average conversion rate | n/a | 7.72% |
| Average cost per lead | n/a | $27.66 |
Source: WordStream 2025 Facebook Ads Benchmarks and LocaliQ. Separately, WebFX reports an average CPM of $7.47 and an average ROAS of 2.79 across industries.
One number to watch is cost per thousand impressions. Ecommerce-weighted data from Triple Whale puts the median CPM at $14.19, up roughly 20% year over year, because purchase campaigns compete in denser auctions than traffic campaigns do. The right CPM benchmark depends on whether you are buying clicks, leads, or sales.
Facebook ads CTR benchmark by industry
Click-through rate is the fastest read on whether your creative and targeting match the audience. A weak CTR usually points at the hook, not the offer.
For traffic campaigns, WordStream's all-industry CTR average is 1.71%. Shopping, Collectibles and Gifts leads at 4.13%, while Automotive Repair and Physicians sit under 0.85%. Lead generation CTRs run higher because the audiences are more qualified, averaging 2.59%.
Facebook ads CPC by industry
Cost per click is where competition shows up in your budget. Regulated, high-value verticals pay a premium because a single customer is worth more.
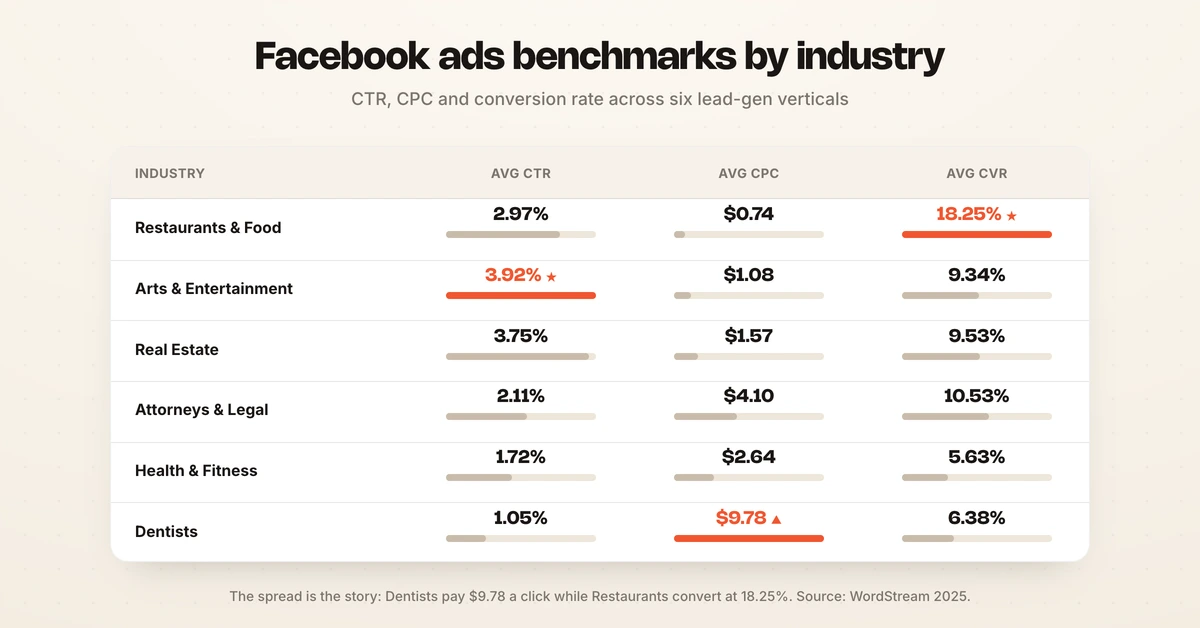
The traffic-campaign CPC average is $0.70, ranging from $0.34 for Shopping and Gifts up to $1.22 for Finance and Insurance. In lead generation, the spread is wider: Restaurants and Food pay $0.74 per click while Dentists pay $9.78. If your CPC is rising while volume holds flat, that is an auction and creative-fatigue signal, not a reason to pause. For a deeper cost breakdown, see the Facebook ads cost guide.
Facebook ads conversion rate benchmark by industry
Conversion rate is the metric that ties spend to outcomes, and it swings hard by objective. A form-fill converts far more often than a checkout.
WordStream's lead generation CVR average is 7.72%. Restaurants and Food top the table at 18.25%, followed by Attorneys and Legal Services at 10.53% and Education at 10.08%. Ecommerce purchase rates sit lower, typically 1% to 3%, because a sale asks more of the visitor than a lead form does.
Full Facebook ads benchmarks table by industry
The table below combines WordStream's lead generation data so you can find your vertical and read CTR, CPC, conversion rate, and cost per lead in one place.
| Industry | Avg CTR | Avg CPC | Avg CVR | Avg CPL |
|---|---|---|---|---|
| Arts and Entertainment | 3.92% | $1.08 | 9.34% | $18.17 |
| Attorneys and Legal Services | 2.11% | $4.10 | 10.53% | $18.17 |
| Beauty and Personal Care | 2.55% | $3.06 | 5.29% | $51.42 |
| Career and Employment | 2.81% | $0.86 | 5.77% | $17.64 |
| Dentists and Dental Services | 1.05% | $9.78 | 6.38% | $76.71 |
| Education and Instruction | 1.86% | $1.65 | 10.08% | $28.22 |
| Furniture | 1.48% | $2.18 | 3.77% | $40.04 |
| Health and Fitness | 1.72% | $2.64 | 5.63% | $52.98 |
| Home and Home Improvement | 1.94% | $2.23 | 5.22% | $41.26 |
| Industrial and Commercial | 2.08% | $1.80 | 9.34% | $37.34 |
| Personal Services | 1.99% | $2.08 | 6.51% | $30.57 |
| Physicians and Surgeons | 3.02% | $2.23 | 4.51% | $47.47 |
| Real Estate | 3.75% | $1.57 | 9.53% | $16.61 |
| Restaurants and Food | 2.97% | $0.74 | 18.25% | $3.16 |
| Sports and Recreation | 3.41% | $1.07 | 5.48% | $19.30 |
Source: WordStream 2025 Facebook Ads Benchmarks. Numbers reflect lead generation campaigns.
Facebook ads CPM by industry
CPM measures what you pay to reach a thousand people, and it is the clearest signal of auction pressure. When CPM climbs without a matching lift in CTR or conversion rate, your reach is getting more expensive without getting more valuable.
Triple Whale's ecommerce data shows every industry saw CPM rise year over year, with Health and Wellness highest at $20.70 and Automotive lowest among tracked verticals near $10.01. WebFX reports a broader cross-industry average of $7.47, so the gap between sources is mostly about whether the data leans ecommerce or general lead generation.
What is a good CTR, CPC, and conversion rate on Facebook
A single benchmark is a starting line, not a grade. Read your numbers against the campaign type and vertical that actually match your account.
For CTR, clearing 2% on a link-click basis means you are ahead of most advertisers. For CPC, anything at or below your industry line in the table above is healthy, and a rising CPC is worth investigating rather than tolerating. For conversion rate, a lead-gen campaign above 7.72% is beating the median, while ecommerce should aim for the 2% to 3% band. If you want to convert these benchmarks into revenue math, the ROAS benchmarks by industry guide covers the return side.
How to use Facebook ads benchmarks
Benchmarks are diagnostic, not prescriptive. Use them to find the metric that is furthest below its line, then fix that one first instead of tweaking everything at once.
Start by matching your campaign objective to the right benchmark set, because comparing a traffic CTR to a lead-gen average will mislead you. Then rank your gaps: a below-average CTR points at creative, a high CPC points at audience or auction pressure, and a weak conversion rate points at the landing page or offer. Work the biggest gap, measure, and move to the next.
From tracking benchmarks to acting on them
Knowing you are 40 cents over the industry CPC does not lower your CPC. Someone still has to notice the gap the day it opens, diagnose which lever moved it, and ship the fix before the budget drains. In most teams that work happens weekly at best, which means days of overspend before anyone reacts.
Hawky is an agentic performance marketing platform, and its Command Center is built to close that loop. It watches your live CTR, CPC, conversion rate, and CPM against ranges like the ones in this guide, flags the metric drifting out of band, and hands the Performance Agent the specific gap to act on. Across 200+ customers, that approach has delivered a +25% ROAS lift in the first 90 days.
The point of a benchmark is to know where you stand. The point of an agent is to move you. You can see how the two fit together on the pricing page.
Frequently asked questions
What is a good CTR for Facebook Ads?
A good link CTR on Facebook is roughly 1.5% to 2% or higher. WordStream puts the all-industry average at 1.71% for traffic campaigns and 2.59% for lead generation campaigns, so clearing 2% means your creative and targeting are beating the median.
What is the average CPC on Facebook by industry?
The average CPC for Facebook traffic campaigns is $0.70 across all industries, per WordStream 2025 data. It ranges from $0.34 for Shopping, Collectibles and Gifts up to $1.22 for Finance and Insurance. Lead generation CPCs run higher, averaging $1.92.
What is a good Facebook conversion rate?
A good Facebook conversion rate depends on the campaign objective. WordStream reports an average lead generation CVR of 7.72%, with legal services and education above 10%. Ecommerce purchase conversion rates are lower, typically landing between 1% and 3%.
What is the average CPM on Facebook in 2026?
Average CPM sits around $7.47 per WebFX, though ecommerce-weighted data from Triple Whale puts the median closer to $14.19, up about 20% year over year. Health and wellness carries the highest CPM at over $20.
Why are Facebook ad benchmarks different across sources?
Different providers measure different account mixes, campaign objectives, and time windows. WordStream separates traffic from lead generation, while ecommerce tools like Triple Whale skew toward purchase campaigns, so use the source whose account profile matches yours.
How often should I compare against Facebook ads benchmarks?
Check benchmarks quarterly for planning and monthly for pacing. Auction costs shift as competition and Advantage+ adoption change, so a stale benchmark can send you chasing the wrong target. Hawky's Command Center tracks your live metrics against these ranges continuously.
If your team is spotting benchmark gaps a week late and burning budget before anyone reacts, Hawky's Command Center is built for that job.
Ready to hire your first AI performance team? Book Demo