How to Analyze Creative Performance: A Step-by-Step Framework
After reading this guide, you will be able to run a repeatable weekly creative analysis loop: pull the right metrics, break ads down to the element level, separate winners from losers, and turn those findings into your next creative brief.
Creative performance analysis is the process of measuring how individual ad creatives and their elements drive business outcomes, then using those findings to decide what to scale, kill, and produce next. Most teams get this wrong in the same way: they stare at campaign-level ROAS, judge ads as a whole, and never learn why a winner won. The framework below fixes that.
What you need before you start
You need three things: ad account access, clean conversion tracking, and enough spend to read signal. Without them, every downstream step produces noise.
Specifically, check that you have admin or analyst access to Meta Ads Manager, Google Ads, or both. Verify your pixel or Conversions API events fire correctly in Meta's Events Manager, since higher event match quality means conversions attribute back to the specific creatives that drove them. And confirm each creative you want to analyze has at least 1,000 impressions or roughly one full conversion cycle of spend behind it.
A spreadsheet works for your first pass. A creative analytics tool becomes worth it once you run more than 20 active creatives at a time.
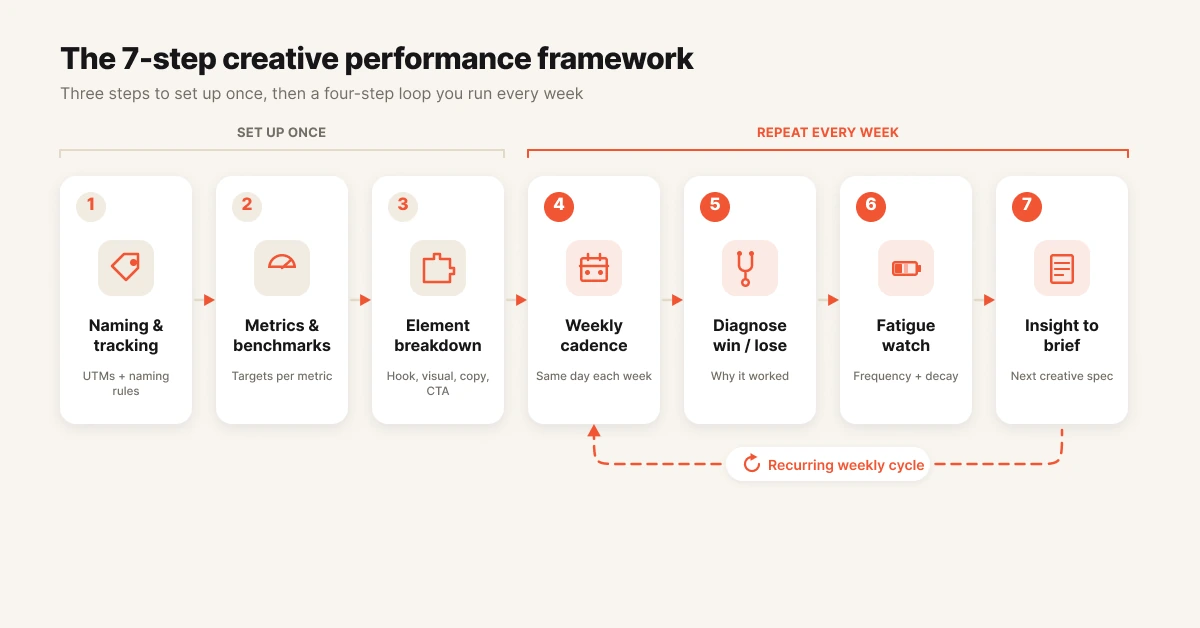
Step 1: Fix your naming convention and tracking
Creative analysis starts with being able to identify what each ad actually is. You should be able to read any ad name in your account and immediately know the format, hook angle, offer, and launch date without opening the ad. If you cannot, fix that before touching a single metric.
A working convention looks like this: 2026-06_video-ugc_hook-painpoint_offer-trial_v3. Format, hook type, offer, and version are all machine-readable, which means you can group and compare creatives by attribute later. This is the unglamorous step that makes element-level analysis possible at all.
Then verify tracking. In Meta, open Events Manager and confirm your purchase or lead events show high match quality. In Google Ads, confirm conversion actions are imported and deduplicated.
Bad tracking does not make analysis harder. It makes analysis wrong.
What done looks like: every active ad follows the convention, and a test conversion shows up attributed to the right ad within 24 hours.
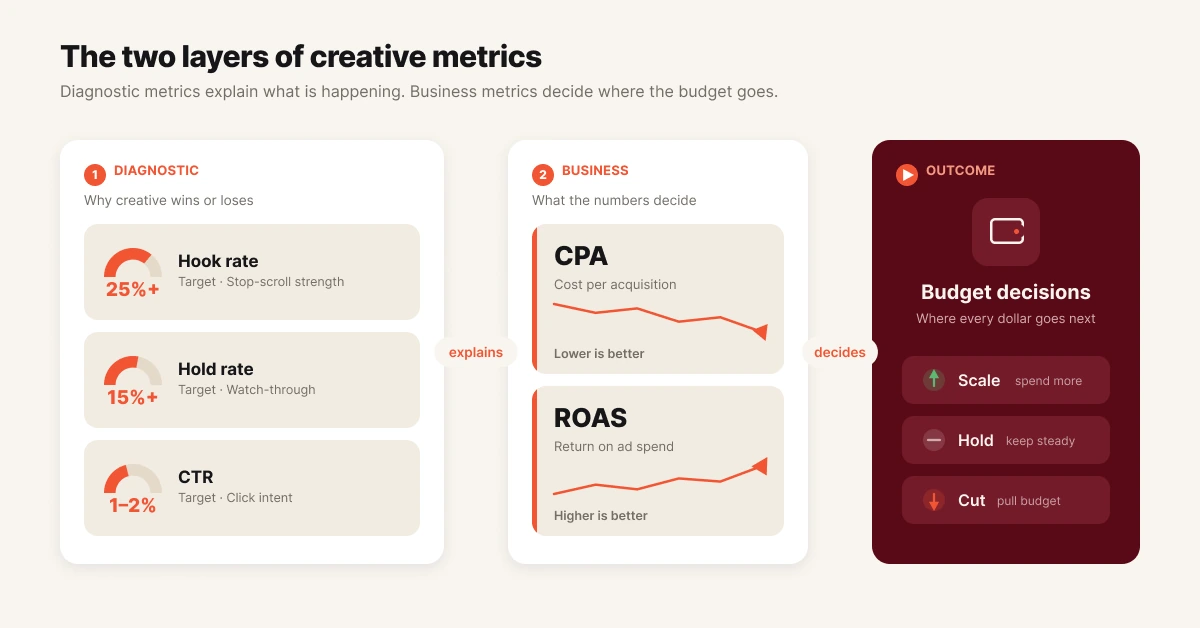
Step 2: Pick your metrics and benchmarks
Strong creative analysis evaluates each ad on two layers: diagnostic metrics that explain attention, and business metrics that justify spend. Diagnostic metrics tell you why an ad works. Business metrics tell you whether it deserves budget.
| Metric | Formula | Benchmark | What it diagnoses |
|---|---|---|---|
| Hook rate (thumbstop rate) | 3-second video views ÷ impressions | 25% average, 30%+ good | Does the first frame stop the scroll? |
| Hold rate | 15-second views ÷ 3-second views | 15%+ solid | Does the story keep attention after the hook? |
| CTR (link) | Link clicks ÷ impressions | 1-2% typical on Meta | Does the message earn a click? |
| Conversion rate | Conversions ÷ link clicks | Varies by offer | Does the promise match the landing page? |
| CPA / CPL | Spend ÷ conversions | Your unit economics | Is the creative profitable? |
| ROAS | Revenue ÷ spend | Your margin target | Should this creative scale? |
The order matters. Hook rate and hold rate are diagnostic signals, not goals. You scale on CPA and ROAS, and you use the diagnostic layer to explain why those numbers look the way they do.
Pro tip: weight metrics for your business context. A subscription brand optimizing for LTV should tolerate a higher CPA on creatives that pull in better-retaining cohorts.
What done looks like: a scorecard with 5-7 metrics, each with a benchmark and a weight, agreed on by whoever controls budget.
Step 3: Break every ad into elements
Element-level analysis is the practice of scoring an ad's individual components (hook, visual, body copy, CTA, offer) instead of judging the ad as a single unit. This is the single biggest upgrade most teams can make. An ad is a bundle of decisions, and the bundle hides which decision did the work.
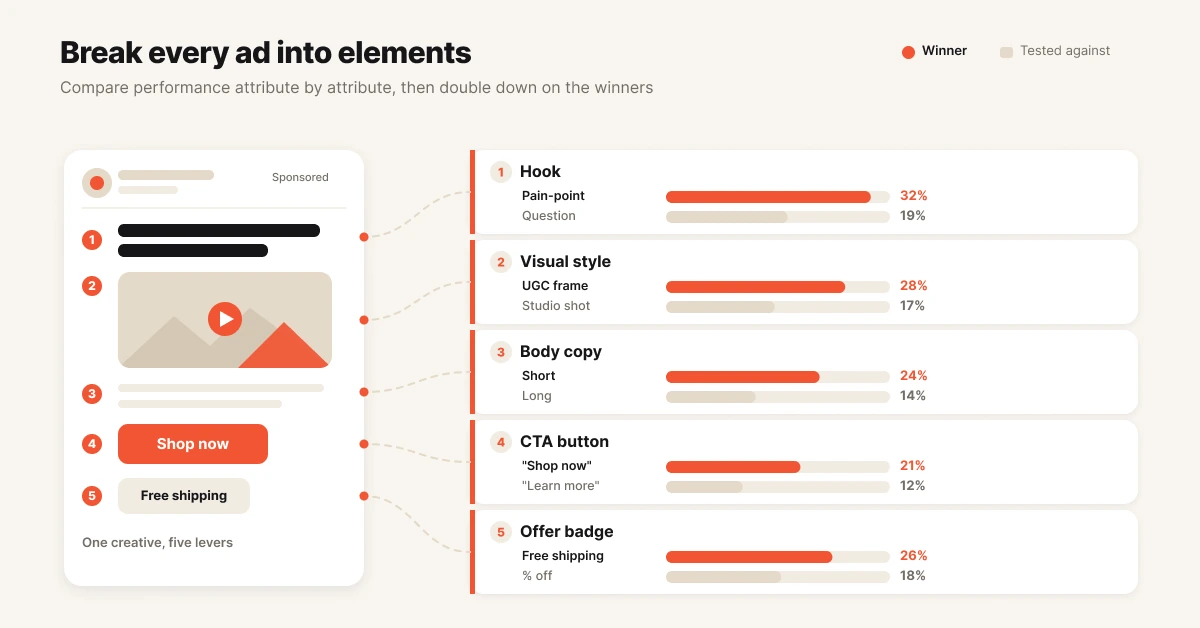
Tag every active creative across five attributes: hook type (question, pain point, social proof, demo), visual style (UGC, studio, motion graphic, static), message angle, CTA, and offer. Your naming convention from Step 1 should carry most of this. The rest lives in a tagging sheet or a creative analytics tool.
Then aggregate performance by attribute, not by ad. When you see that pain-point hooks average a 32% hook rate across nine ads while question hooks average 19%, you have learned something no single A/B test can teach you. That pattern is repeatable. A winning ad is not.
What done looks like: a pivot table (or dashboard) showing average hook rate, CTR, and CPA grouped by hook type, visual style, and offer.
Step 4: Build a weekly creative performance analysis cadence
Creative analysis works when it runs on a schedule, not when someone remembers to do it. A weekly cadence is the standard for accounts spending $50k+/month, because that spend level generates enough fresh signal each week to act on.
Run the same loop every week:
- Pull all creatives with 1,000+ impressions in the last 7 days.
- Rank them on your weighted scorecard from Step 2.
- Flag the top 10% and bottom 20%.
- Update your element-level pivot from Step 3 with the new week of data.
- Log decisions: what you scaled, killed, and queued for iteration, and why.
The decision log is the part most teams skip and regret. Three months from now, nobody remembers why an ad was paused. A log turns your account history into training data for your team, and increasingly, for AI agents that act on it.
What done looks like: a recurring 45-minute block on the calendar and a log with one row per decision.
Step 5: Diagnose winners and losers
Reading the scorecard is mechanical. Diagnosis is where analysis earns its keep. The metric combination tells you which element failed, and that tells you what to fix.
| Pattern | Likely problem | Action |
|---|---|---|
| Low hook rate, everything else fine | First 3 seconds fail to stop the scroll | Re-cut the opening, keep the body |
| High hook rate, low hold rate | Hook overpromises, story underdelivers | Rewrite the middle, keep the hook |
| High CTR, low conversion rate | Ad-to-landing-page mismatch | Fix the page or align the promise |
| Strong everything, high CPA | Audience or bid problem, not creative | Leave the creative alone |
| Was strong, now declining | Creative fatigue | See Step 6 |
Treat winners with the same rigor. "It works" is not an insight. Pull the winner apart: which hook, which visual style, which offer?
Check whether the same elements win elsewhere in your element-level pivot. A winner you can explain becomes a pattern you can reproduce. A winner you cannot explain is luck wearing a ROAS costume.
What done looks like: every flagged ad has a one-line diagnosis and a next action, not just a pause/scale label.
Step 6: Watch for creative fatigue
Creative fatigue is the decline in ad performance that occurs when an audience has seen a creative too many times. It shows up as falling hook rate and CTR with rising frequency and CPA, and it kills more "proven winners" than bad testing ever will.
Watch three signals together: ad frequency climbing past 3x on prospecting audiences, hook rate dropping week over week (a 35% thumbstop creative sliding to 15% is a typical fatigue curve), and CPA rising while nothing else in the account changed. Any one signal alone can be noise. Two or three together is fatigue.
The response is rotation, not panic. Queue a refresh before the winner dies: new hook on the same body, new visual on the same script. Teams that monitor fatigue weekly catch it 4-7 days earlier than teams that wait for monthly reports, and those days are the difference between a planned refresh and a CPA spike.
What done looks like: a fatigue watchlist updated weekly, with a refresh already in production for every creative on it.
Step 7: Turn insights into the next brief
Analysis that never reaches the creative team is reporting, not analysis. The final step closes the loop: translate this week's element-level findings into next week's creative brief.
A good insight-to-brief handoff has three parts. State the pattern with evidence ("pain-point hooks beat question hooks on hook rate, 32% vs 19%, across 9 creatives"). State the hypothesis ("a pain-point hook on your best demo body should beat control"). State the test design (one variable changed, a clear success metric, a minimum spend threshold before judgment).
Brief 2-3 iterations of winners for every 1 net-new concept. Iteration compounds what you have learned. Net-new concepts feed the pattern library with fresh raw material. Both matter, and the ratio keeps you from churning out variations of a fatigued idea forever.
What done looks like: a written brief per test, each traceable to a specific finding in your decision log.
Common mistakes when you analyze creative performance
Judging ads as a whole. You learn nothing transferable from "ad 14 won". Break performance down by element, or every new brief starts from zero. Tag attributes and compare across ads instead.
Scaling on diagnostic metrics. Hook rate measures attention, not profit. Scale on CPA and ROAS, and use hook and hold rates to explain them. Watching 3 seconds of video pays no invoices.
Testing three variables at once. When you change the hook, visual, and offer together, the result is unreadable. Change one variable per test: new hook on a proven body, or proven hook on a new CTA.
Calling tests early. A creative with 40 clicks and no spend history tells you nothing. Set minimum thresholds (1,000+ impressions, a full conversion cycle of spend) and respect them even when early numbers look exciting.
Analyzing without acting. A weekly report nobody executes is decoration. Every analysis session should end with creatives paused, budgets shifted, or briefs written. If your loop ends at a dashboard, it is not a loop.
Tools that make this easier
Spreadsheets (free). A pivot table over an ad-level export handles Steps 2-5 for small accounts. It breaks down past 20-30 active creatives, when manual tagging and weekly exports start eating hours.
Motion. Strong visual reporting layer for creative teams on Meta. Good for building creative-first dashboards, though users on G2 cite annual-only contracts and spend-based pricing as friction, and you still do the interpretation and acting yourself.
Foreplay. Built around ad inspiration, competitor research, and creative workflow, with analytics attached. A fit when your bottleneck is the production pipeline rather than performance analysis depth.
Hawky. Hawky runs this entire framework as an agentic loop rather than a dashboard. Its Creative Analysis breaks ads down at the hook, visual, CTA, and body level automatically, the Performance Agent runs the weekly test-track-optimize-scale cadence against your KPI with every action logged and reversible, and the Creative Agent turns winning patterns into finished on-brand creatives routed through your approval. Analysis, fatigue alerts, and the next brief stop being manual steps. They become autonomous steps with guardrails, which is the difference between reading about your account and operating it.
Evaluating the category more broadly? See Hawky's roundup of the 8 best tools to evaluate creative performance.
Frequently asked questions
What is creative performance analysis?
Creative performance analysis is the process of measuring how individual ad creatives and their elements (hooks, visuals, copy, CTAs) drive business outcomes like CPA and ROAS, then using those findings to decide what to scale, kill, and produce next.
What metrics measure ad creative performance?
The core set is hook rate (3-second views ÷ impressions), hold rate, CTR, conversion rate, CPA, and ROAS. Hook and hold rates diagnose attention. CPA and ROAS decide budget. Strong frameworks weight 5-7 metrics rather than optimizing any single one.
What is a good hook rate for video ads?
On Meta, around 25% is average and above 30% is good, with top performers exceeding 40%. Hook rate is a diagnostic signal for the first 3 seconds of a video, not a scaling criterion. Scale on profit metrics like CPA and ROAS.
How do you know when a creative is fatigued?
Creative fatigue shows up as a combination of signals: frequency above 3x on prospecting audiences, hook rate and CTR declining week over week, and CPA rising without other account changes. Two or more signals together indicate fatigue. Respond by rotating in a refreshed variant.
How often should you analyze creative performance?
Weekly is the standard cadence for accounts spending $50k+/month, because a week generates enough new data to act on without overreacting to noise. Smaller accounts can review every two weeks. Fatigue signals and spend anomalies should be monitored continuously through automated alerts.
What is the difference between creative testing and creative analysis?
Creative testing is the controlled experiment: launching variants to see which performs better. Creative analysis is the interpretation layer: understanding why performance differs by breaking ads into elements and finding repeatable patterns. Testing produces data. Analysis produces the next brief.
If your creative analysis still ends at a dashboard instead of an action, Hawky's Performance Agent and Creative Agent are built for that job. They run the analyze-diagnose-refresh loop autonomously, with guardrails, approvals, and a full audit trail, so your team keeps the judgement and loses the manual labor.
Ready to hire your first AI performance team? Book a demo.