12 Creative Performance Metrics Every Performance Marketer Should Track
The 12 creative performance metrics every performance marketer should track are hook rate, hold rate, average watch time, click-through rate, engagement rate, conversion rate, cost per acquisition, return on ad spend, cost per mille, creative frequency, creative win rate, and time-to-launch. Together they cover the full path a creative travels: stopping the scroll, holding attention, earning the click, converting, and staying profitable.
Most marketers track three of these and call it measurement. The result is a creative that wins on click-through rate while quietly bleeding on cost per acquisition, caught a week too late. This guide breaks down all 12, gives you the benchmark for each, and shows where each one fits in the funnel so you can read a creative the way the algorithm does.
What creative performance metrics actually measure
Creative performance metrics are the quantitative signals that show how an ad creative earns attention, engagement, and conversions across its lifecycle. They isolate the creative's contribution from targeting and bidding, so you know whether the asset itself is doing the work or whether the platform is carrying it.
Platforms like Meta and Google read these signals before you do. A creative that loses most viewers in the first three seconds tells the algorithm the asset is low-relevance, which means reduced delivery, higher CPMs, and worse efficiency across the whole campaign. The metrics on this list are the same ones the auction uses to decide how far your creative travels.
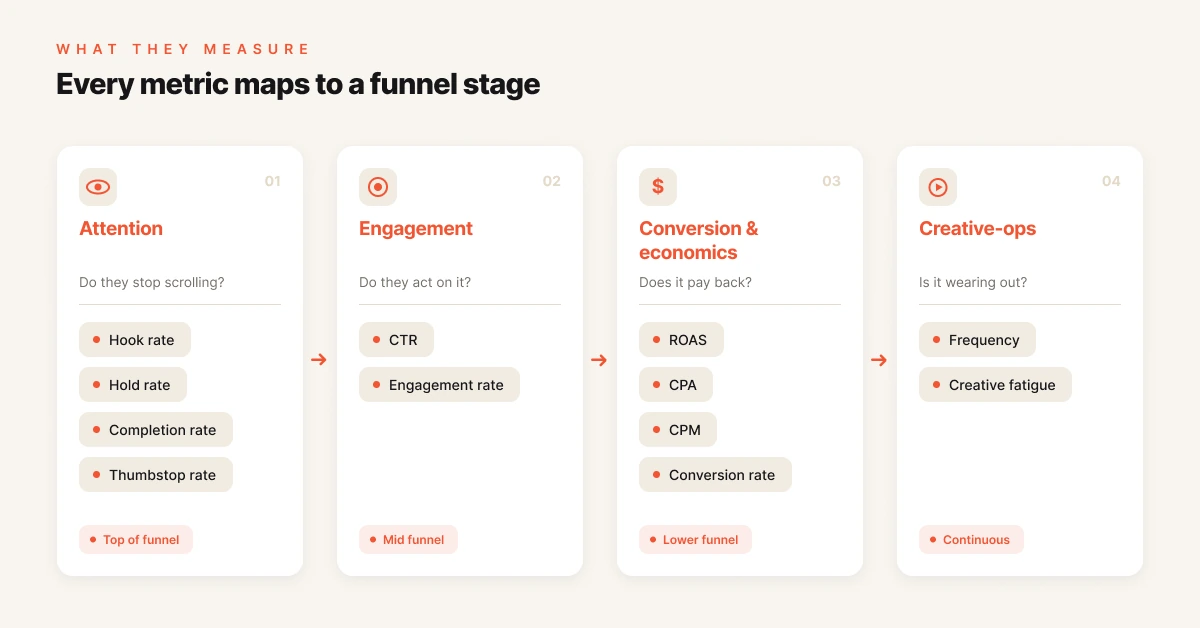
The useful way to group them is by funnel stage. Each stage answers a different question about the creative, and tracking one in isolation means you optimize a number while the outcome slips.
| Funnel stage | What it answers | Metrics in this stage |
|---|---|---|
| Attention | Does the creative stop the scroll? | Hook rate, hold rate, watch time |
| Engagement | Does it hold interest and earn the click? | CTR, engagement rate |
| Conversion and economics | Does it drive profitable results? | Conversion rate, CPA, ROAS, CPM |
| Creative-ops | Can the pipeline keep producing winners? | Frequency, win rate, time-to-launch |
The 12 creative performance metrics
1. Hook rate (thumbstop rate)
Hook rate is the percentage of people who watch the first three seconds of a video ad, calculated as 3-second video views divided by impressions. It is the single clearest read on whether your creative stops the scroll, and it is the first signal the algorithm uses to decide how widely to distribute the ad.
On Meta, a hook rate of 25 to 30 percent is solid, 30 to 40 percent is good, and anything above 40 percent is elite. Below 25 percent, the opening frame is not earning attention and the rest of the creative never gets a fair test. Fix the first three seconds before you touch anything else, because every downstream metric depends on it.
2. Hold rate
Hold rate measures how many viewers who stopped scrolling kept watching, calculated as 15-second video plays divided by 3-second video plays. Where hook rate proves the opening works, hold rate proves the middle does. A strong hook with a weak hold means the creative promised something the body never delivered.
Average hold rates land between 40 and 50 percent. A low hold rate usually points to a pacing problem, a slow second act, or a message that drifts from the hook. Reading hook rate and hold rate together tells you exactly where attention breaks.
3. Average watch time and completion rate
Average watch time is the mean duration viewers spend on a video ad, and completion rate is the percentage who watch to the end. These two metrics expose the back half of the creative, the part hook and hold rate cannot see. A completion rate of 30 to 40 percent is strong for most paid social placements.
Aim for an average watch time near 50 percent of the video's duration. When watch time clusters just past the hook and falls off a cliff, the creative is front-loaded and the offer or CTA never lands. Longer creatives need a reason to keep watching at every beat, not just the open.
4. Click-through rate (CTR)
Click-through rate is the percentage of people who click after seeing your ad, calculated as clicks divided by impressions. Use link CTR, not all-clicks CTR, because link CTR isolates intent to visit your landing page rather than counting incidental engagement. It is the bridge metric between attention and conversion.
A link CTR above 1.5 percent is solid on Meta, while TikTok runs lower at roughly 0.8 to 1.0 percent. CTR gauges stopping power and message-offer fit at once. A rising CTR with a flat conversion rate usually means the creative writes a check the landing page cannot cash.
5. Engagement rate
Engagement rate measures how users interact with a creative beyond the click, including likes, comments, shares, and saves, expressed as total engagements divided by impressions or reach. Shares and saves carry the most weight because they signal the creative is worth passing on or returning to. Both extend organic reach and lower effective CPMs.
Engagement rate is the metric most likely to be vanity if you read it alone. Pair it with conversion data before you scale a high-engagement creative, because attention without intent does not pay. A creative that earns comments but no clicks is entertaining, not converting.
6. Conversion rate (CVR)
Conversion rate is the percentage of clicks that complete the desired action, such as a purchase, lead, or signup. It measures message and offer fit more directly than any other metric on this list, because it isolates whether the promise made in the creative survived the click. A strong landing-page conversion rate on Meta can reach the high single digits, though it varies sharply by category and offer.
Conversion rate is where creative meets product and price. When CVR drops while CTR holds, the creative is attracting the wrong audience or overselling. Segment CVR by creative to find which hooks bring buyers rather than browsers.
7. Cost per acquisition (CPA) or cost per lead (CPL)
Cost per acquisition is the total spend divided by the number of conversions, and cost per lead is the same calculation for lead-gen objectives. It is the cleanest read on whether a creative's economics work, because it folds delivery cost, CTR, and conversion rate into one number. A creative can win on every upstream metric and still fail here.
Track CPA at the creative level, not just the campaign level. Campaign-level CPA hides the truth that two creatives can average out to an acceptable number while one quietly drains budget. The Hiveminds team cut CPL by 27 percent by acting on creative-level signals rather than campaign averages.
8. Return on ad spend (ROAS)
Return on ad spend is the revenue generated for every dollar spent, calculated as revenue divided by ad spend. It is the profitability metric most leadership cares about, and the one that decides whether a winning creative gets more budget. ROAS reveals whether the economics make sense once attention and conversion have done their part.
A good ROAS depends entirely on your margin structure, so benchmark it against your own contribution margin rather than an industry average. A 3x ROAS funds growth for one brand and loses money for another. Read ROAS alongside CPA, because a high ROAS on tiny spend is not the same as a durable, scalable creative.
9. Cost per mille (CPM)
Cost per mille is the cost per thousand impressions, and it is the clearest signal of delivery health. Rising CPMs on the same audience usually mean the algorithm is deprioritizing your creative, often because attention metrics like hook rate have slipped. CPM is the early warning that delivery is getting expensive before CPA confirms it.
Watch CPM trend, not the absolute number. A creeping CPM on a creative you have run for weeks is the fingerprint of fatigue. When CPM climbs while frequency rises, the audience has seen the creative too often and the auction is charging you for it.
10. Creative frequency
Creative frequency is the average number of times a person has seen a specific creative, and it is the leading indicator of creative fatigue. On a cold audience, fatigue risk climbs sharply once frequency passes roughly 2.5 to 3.0. Frequency is the metric that tells you to refresh before performance drops, not after.
The cost of ignoring frequency is paid in CPM and CPA a few days later. Catching fatigue 4 to 7 days earlier, before the spike, is the difference between rotating a creative on schedule and scrambling after a bad week. Set a frequency threshold per audience and treat it as a trigger, not a report.
11. Creative win rate
Creative win rate is the percentage of new creatives that beat your current control, and it measures the health of your testing engine rather than any single ad. A team shipping 20 creatives a month with a 15 percent win rate produces three new winners; a team shipping five with the same rate produces fewer than one. Win rate ties creative volume to actual performance gains.
Track win rate alongside testing velocity, the number of distinct creative hypotheses you put live per cycle. The two together explain why some teams compound and others plateau. The Man Company doubled creative performance and cut iteration cycles in half by raising both at once.
12. Time-to-launch
Time-to-launch is the elapsed time from creative brief to live ad, and it is the creative-ops metric most directly tied to how fast you can act on every metric above. A fast feedback loop is worthless if it takes two weeks to ship the next iteration. This metric exposes where production, approvals, and trafficking slow you down.
Shorten time-to-launch and every other metric improves, because you test more, learn faster, and replace fatiguing creatives before CPM climbs. Teams that compress this loop turn insight into shipped creative in days, not weeks. It is the metric that determines whether your measurement actually changes anything.
Creative performance metrics benchmark table
Use these as starting reference points, then recalibrate against your own account history, vertical, and margin. Benchmarks orient you; your own baseline is the real target.
| Metric | What it measures | Formula | Benchmark to aim for |
|---|---|---|---|
| Hook rate | Scroll-stopping power | 3-sec views / impressions | 30%+ (40%+ elite) |
| Hold rate | Attention retention | 15-sec plays / 3-sec plays | 40-50% |
| Completion rate | Full-view-through | Completions / impressions | 30-40% |
| Link CTR | Click intent | Link clicks / impressions | 1.5%+ (Meta) |
| Engagement rate | Interaction depth | Engagements / reach | Above account average |
| Conversion rate | Offer and message fit | Conversions / clicks | Category-dependent |
| CPA / CPL | Acquisition economics | Spend / conversions | Below target payback |
| ROAS | Profitability | Revenue / ad spend | Above contribution margin |
| CPM | Delivery health | Spend / (impressions/1,000) | Stable or falling trend |
| Frequency | Fatigue risk | Impressions / reach | Under 2.5-3.0 (cold) |
| Creative win rate | Testing health | Winners / creatives tested | Track trend upward |
| Time-to-launch | Production speed | Brief-to-live duration | Days, not weeks |
Which metric matters most?
No single creative metric matters most, because each one measures a different stage and optimizing one in isolation breaks another. The right approach is a multi-KPI read: weigh attention, engagement, and conversion together rather than chasing one number. A creative is only as strong as its weakest stage.
The practical method is to read the metrics as a chain and find the break. If hook rate is high but hold rate collapses, fix the body. If CTR is strong but conversion rate is weak, fix the landing page or the offer the creative implies.
If CPA is creeping while everything upstream looks fine, check CPM and frequency for fatigue. The metric that matters most is whichever one is currently the bottleneck.
This is also why creative-level reporting beats campaign-level reporting. Campaign averages hide the single creative dragging the set, and they hide the winner you should be scaling. Reading each metric per creative is how you find both, and Hawky's guide on how to find your winning creative with data walks through the method. If you are evaluating software for this, the roundup of the best tools to evaluate creative performance breaks down the options.
How agents turn these metrics into action
A metric only earns its place if something acts on it. Most stacks stop at the dashboard, which describes the past and leaves the work to a human who checks it the next morning. The gap between a fatiguing creative and a refreshed one is usually measured in days of manual monitoring, and those days cost CPM and CPA.
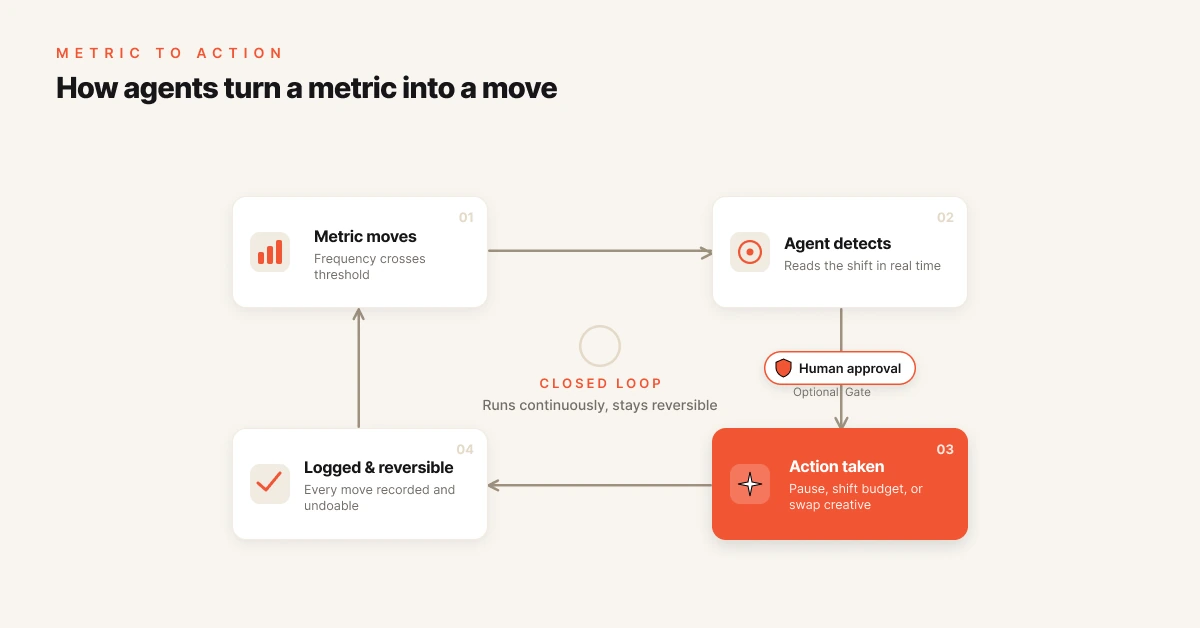
This is the job Hawky's Performance Agent is built for. It runs a closed loop against your KPI, watching these metrics 24/7 and acting on them: pausing a creative when frequency crosses your threshold, shifting budget toward a winner, flagging fatigue before CPM spikes. Every move is logged with the trigger data and a confidence score, and every move is one-click reversible. You set the guardrails and spend caps, and the agent operates inside them.
The same logic applies to producing the next creative. When a metric says an asset is fatiguing, Hawky's Creative Agent reads your past winners and renders on-brand replacements, routed through seat-level approval before anything goes live. That is the autonomy unlock for creative teams: the agents handle the labor of monitoring and production, the audit trail keeps every action reviewable, and your team keeps the judgement. Autonomy is configurable, so you start in shadow mode, move to approval-gated, and loosen the gate only as trust builds.
The point is not to remove people from the loop. It is to close the distance between a metric moving and someone acting on it, with creative-level analysis feeding both agents so every decision cites the evidence behind it.
If your team is tracking these 12 metrics but acting on them a week late, Hawky's Performance Agent and Creative Agent are built for that job.
Ready to hire your first AI performance team? Book Demo
Frequently asked questions
What are creative performance metrics?
Creative performance metrics are quantitative signals that measure how an ad creative earns attention, engagement, and conversions across its lifecycle. They isolate the creative's contribution from targeting and bidding, covering attention (hook rate, hold rate), engagement (CTR, engagement rate), conversion and economics (conversion rate, CPA, ROAS), and creative-ops (win rate, time-to-launch).
What is a good hook rate for Facebook ads?
A good hook rate on Facebook and Meta is 30 to 40 percent, with anything above 40 percent considered elite. A hook rate of 25 to 30 percent is solid, and below 25 percent signals the first three seconds are not stopping the scroll. Hook rate is calculated as 3-second video views divided by impressions.
What is the difference between hook rate and hold rate?
Hook rate measures whether your creative stops the scroll, calculated as 3-second views divided by impressions. Hold rate measures whether it keeps attention, calculated as 15-second plays divided by 3-second plays. A high hook rate with a low hold rate means a strong opening that the body of the creative fails to deliver on.
How do you measure creative fatigue?
You measure creative fatigue by watching frequency, CPM trend, and CPA together. Rising frequency past roughly 2.5 to 3.0 on a cold audience, paired with climbing CPM and CPA on the same creative, indicates fatigue. The goal is to catch it 4 to 7 days early, before the cost spike, and refresh the creative on a trigger rather than a schedule.
What is a good ROAS for paid social?
A good ROAS depends entirely on your contribution margin, so it should be benchmarked against your own economics rather than an industry number. A 3x ROAS can fund growth for one brand and lose money for another with thinner margins. Always read ROAS alongside CPA and the spend level it was achieved at, because high ROAS on tiny spend is not a scalable result.
Should I track creative metrics at the campaign or creative level?
Track them at the creative level. Campaign-level averages hide the single creative dragging performance down and obscure the winner you should be scaling. Creative-level reporting is the only way to find which specific hooks, formats, and messages are earning their delivery.