Average Ad Conversion Rate: What's Good and Benchmarks by Industry
The average ad conversion rate runs between roughly 6% and 9% depending on the platform, with Google Search ads averaging 6.96% and Meta lead ads averaging 8.78% across all industries in 2024 (WordStream, 2024).
That single number hides a lot. A "good" ad conversion rate for a plumber running Google Search is not the same as a good rate for a fashion brand running Meta prospecting. This guide defines ad conversion rate, gives you real platform and industry benchmarks, and shows how to read your own number without fooling yourself.
What is ad conversion rate?
Ad conversion rate is the share of ad clicks that turn into a defined conversion, calculated as conversions divided by clicks, then multiplied by 100. If 1,000 people click your ad and 50 complete the action you care about, your conversion rate is 5%. The conversion can be a purchase, a lead form, a signup, a call, or an add to cart, so the metric only means something once you name the action.
This is a click-to-conversion measure, not a view-to-conversion measure. It sits one step below click-through rate (CTR), which counts clicks against impressions, and one step above cost per acquisition (CPA), which prices each conversion. For a refresher on the metric above it, see the guide on what a good CTR is.
Conversion rate is a ratio, so it moves for two very different reasons. Either the ad is attracting better-qualified clicks, or the destination is doing a better job of closing them. Keeping those two causes separate is the whole game, and most of this article comes back to it.
What is a good ad conversion rate?
A good ad conversion rate is one that beats the median for your platform, industry, and conversion type, which usually means clearing 6% to 10% on lead-focused campaigns. Anything above the all-industry average of 6.96% on Google Search is competitive, and top-quartile advertisers push past 10% (WordStream, 2024). Ecommerce purchase conversion sits lower, often 2% to 4%, because buying costs more commitment than filling out a form.
The honest answer is that "good" is relative. A 3% rate can be excellent for a high-ticket B2B purchase and poor for a free newsletter signup. The benchmark tables below give you a like-for-like comparison so you are not judging a Search lead-gen campaign against an ecommerce Display campaign.
Chasing a single target number is where teams go wrong. The goal is a conversion rate that produces profitable ROAS or an acceptable CPA at the volume you need, not a vanity percentage that looks good in a screenshot.
Average ad conversion rate benchmarks by platform
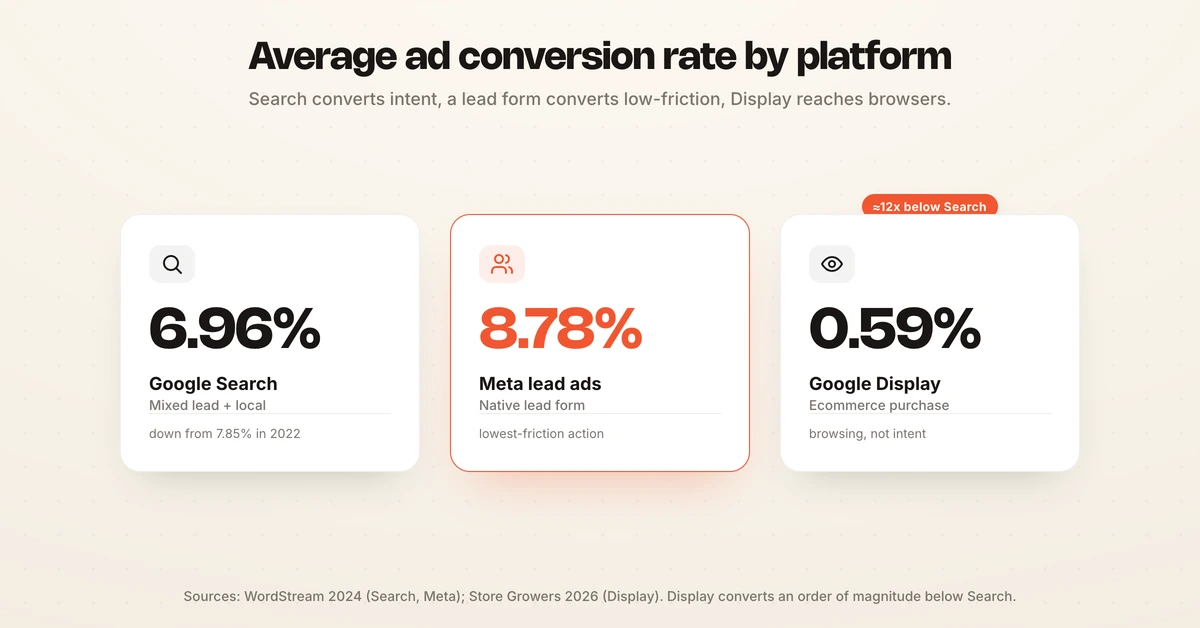
The average ad conversion rate changes sharply by platform, network, and conversion action. High-intent Search converts far better than interruptive Display, and lead forms convert better than purchases. The table below compares the current all-industry medians from three independent benchmark studies.
| Platform / network | Average conversion rate | Conversion type | Source (year) |
|---|---|---|---|
| Google Search ads | 6.96% | Mixed lead + local | WordStream (2024) |
| Meta lead ads | 8.78% | Lead form | WordStream (2024) |
| Google Search (ecommerce) | 2.81% | Purchase | Store Growers (2026) |
| Google Display (ecommerce) | 0.59% | Purchase | Store Growers (2026) |
| Landing pages (all traffic) | 6.6% | Mixed | Unbounce (Q4 2024) |
Two patterns stand out. Google Display converts at roughly an order of magnitude below Search, because Display reaches people who are browsing, not searching with intent (Store Growers, 2026). Meta lead ads post the highest median here because a native lead form is a low-friction action, not a checkout.
The all-industry Google average has also been drifting down as auctions get more expensive, from 7.85% in 2022 to 7.04% in 2023 to 6.96% in 2024 (LocaliQ, 2024). A flat conversion rate in a rising-cost auction still means your efficiency is improving relative to the field.
Average conversion rate by industry on Google Search
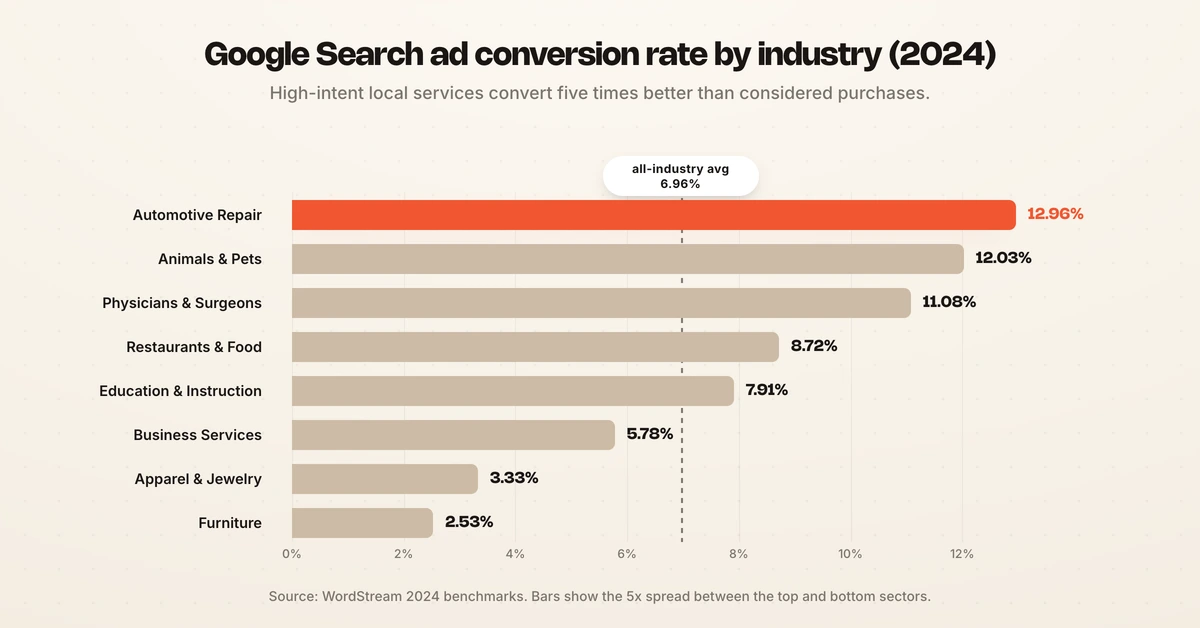
Average conversion rate by industry ranges from about 2.5% to 13% on Google Search, a spread of more than 5x between the top and bottom sectors. Service industries with urgent, local demand convert highest, while considered purchases and low-intent browsing convert lowest. The full 2024 breakdown is below.
| Industry | Google Search conversion rate |
|---|---|
| Automotive – Repair, Service & Parts | 12.96% |
| Animals & Pets | 12.03% |
| Physicians & Surgeons | 11.08% |
| Personal Services | 8.83% |
| Restaurants & Food | 8.72% |
| Home & Home Improvement | 8.62% |
| Dentists & Dental Services | 8.36% |
| Beauty & Personal Care | 8.01% |
| Education & Instruction | 7.91% |
| Health & Fitness | 7.40% |
| Industrial & Commercial | 6.84% |
| Automotive – For Sale | 6.49% |
| Business Services | 5.78% |
| Attorneys & Legal Services | 5.64% |
| Career & Employment | 5.63% |
| Travel | 5.36% |
| Sports & Recreation | 5.35% |
| Arts & Entertainment | 4.22% |
| Shopping, Collectibles & Gifts | 3.49% |
| Apparel / Fashion & Jewelry | 3.33% |
| Real Estate | 2.91% |
| Finance & Insurance | 2.78% |
| Furniture | 2.53% |
Source: WordStream, 2024 Google Ads Benchmarks.
The pattern is intent, not luck. Someone searching "emergency brake repair near me" is ready to book, so Automotive Repair converts at 12.96%, while Furniture buyers compare for weeks and convert at 2.53% (WordStream, 2024). Read your own number against your row in this table, not against the 6.96% average. For a deeper look at the same dataset across CTR, CPC, and CPA, see the Google Ads benchmarks guide.
Meta ad conversion rate benchmarks by industry
Meta ad conversion rate benchmarks tell a different story from Search, because Meta is interruptive rather than intent-driven. On lead campaigns, the all-industry median is 8.78%, and the industry order reshuffles compared with Google (WordStream, 2024). Industrial and home-service categories convert highest, while categories that dominate on Search fall lower.
| Industry | Meta lead ad conversion rate |
|---|---|
| Industrial & Commercial | 12.03% |
| Dentists & Dental Services | 9.83% |
| Real Estate | 9.70% |
| Personal Services | 9.19% |
| Home & Home Improvement | 8.87% |
| Sports & Recreation | 8.87% |
| Education & Instruction | 8.49% |
| Business Services | 8.34% |
| Attorneys & Legal Services | 7.57% |
| Furniture | 6.11% |
| Finance & Insurance | 5.98% |
| Beauty & Personal Care | 5.93% |
| Health & Fitness | 5.78% |
| Automotive – Repair, Service & Parts | 4.86% |
| Physicians & Surgeons | 4.81% |
Source: WordStream, Facebook Ads Benchmarks 2024. Figures are median lead-campaign conversion rates.
Notice how Real Estate converts at 9.70% on Meta lead ads but only 2.91% on Google Search. The lead form captures interest cheaply on social, while a Search click for a considered purchase rarely closes on the first visit. Comparing your Meta and Google numbers directly, without adjusting for this, will lead you to the wrong budget decisions. The Facebook Ads benchmarks guide and the TikTok Ads benchmarks round out the social picture.
Ad conversion rate vs. landing-page conversion rate
Ad conversion rate and landing-page conversion rate measure different halves of the same funnel, and confusing them wastes budget. Ad conversion rate is clicks to conversions across the whole path. Landing-page conversion rate, the focus of conversion rate optimization (CRO), is visits to conversions once someone reaches your page.
The two overlap but are not the same. Your ad controls who clicks and how qualified they are. Your landing page controls whether those visitors convert once they arrive, which is why the median landing page converts at 6.6% across all traffic sources, ranging from about 3.8% in SaaS to 12.3% in events and entertainment (Unbounce, Q4 2024).
| Dimension | Ad conversion rate | Landing-page conversion rate (CRO) |
|---|---|---|
| Denominator | Ad clicks | Page visits from all sources |
| What it grades | Targeting, offer, ad relevance | Page design, copy, load speed, form UX |
| Owned by | Media buyer | CRO / web team |
| Typical lever | Audience, keyword, creative | Headline, layout, form fields, speed |
When a conversion rate drops, this split tells you where to look first. If clicks held steady but conversions fell, suspect the page or offer. If the clicks themselves got worse, suspect targeting, keyword match, or creative fatigue. A shared glossary helps keep a team aligned on which metric each person is actually reporting.
Why ad conversion rate matters for ROAS and CPA
Ad conversion rate is the hinge between traffic and profit, because it converts clicks you paid for into the outcomes that pay you back. Hold cost per click flat and a jump from 5% to 7.5% cuts your effective CPA by a third, which flows straight into ROAS. That is why a small conversion-rate gain often beats a large CTR gain.
The metric also decides how far you can scale. A campaign that converts well can absorb a higher CPC and still stay profitable, so it wins more auctions and more budget. A campaign with a weak conversion rate burns spend the moment you push volume, because every extra click costs money and few of them pay off.
This is where CPM and CPC connect to the bottom line. Cheap impressions and cheap clicks mean nothing if they do not convert, and expensive clicks can be a bargain if they convert at twice the benchmark. Conversion rate is the multiplier that decides which is which.
How to improve your ad conversion rate
Improving ad conversion rate starts with tightening the match between the click and the offer, then removing friction on the path to the action. The highest-impact moves usually happen before the landing page, in who you target and what you promise. These five steps cover the essentials.
- Tighten intent. Cut broad keywords and lookalike segments that draw curious clicks, and add negatives and exclusions. Fewer, better-matched clicks lift conversion rate even if total clicks fall.
- Match message to moment. Make the ad, the keyword or audience, and the landing page tell one continuous story. A mismatch between ad promise and page content is the fastest way to lose a click you paid for.
- Reduce friction. Shorten forms, speed up load time, and remove steps between click and conversion. On lead ads, native forms convert well precisely because they cut friction.
- Test creative against fatigue. Rotate hooks and formats before performance decays, and watch for rising frequency and falling CTR as early warning signs of creative fatigue.
- Read conversion rate by segment, not in aggregate. A healthy blended rate can hide one segment quietly bleeding budget. Break the number down by campaign, placement, device, and audience.
The hard part is doing this continuously across Meta, Google, and TikTok at once, where signals move faster than a weekly review can catch. Hawky's Command Center unifies cross-platform performance into one view so conversion-rate decay surfaces as a ranked task instead of a surprise at month-end. Its Performance Agent then runs the test-track-optimize-scale loop autonomously, inside spend caps and approval gates you set, with every change logged and one-click reversible.
That closed loop is why teams using the agents report a +25% ROAS median in the first 90 days across 200+ active accounts (Hawky case studies). The point is not to replace the media buyer, but to move the manual monitoring to an agent so the human keeps the judgement. Pricing for that model is outcome-based, detailed on the pricing page.
Frequently asked questions
What is a good ad conversion rate?
A good ad conversion rate beats the median for your platform and industry, which for lead-focused campaigns usually means clearing 6% to 10%. On Google Search, anything above the 6.96% all-industry average is competitive, and the top quartile converts above 10% (WordStream, 2024). Ecommerce purchase conversion is naturally lower, often 2% to 4%.
What is the average conversion rate for ads?
The average ad conversion rate is 6.96% on Google Search and 8.78% on Meta lead ads across all industries (WordStream, 2024). Google Display converts far lower, near 0.59% for ecommerce, because it reaches browsing rather than searching users (Store Growers, 2026). The right average depends on your platform and conversion type.
What is a good conversion rate by industry?
Conversion rate by industry ranges widely: on Google Search it runs from about 12.96% for Automotive Repair down to 2.53% for Furniture (WordStream, 2024). High-intent local services convert highest, while considered purchases and browsing categories convert lowest. Compare your rate to your own industry row, not to the overall average.
How do you calculate ad conversion rate?
Ad conversion rate is conversions divided by ad clicks, multiplied by 100. If 800 clicks produce 40 conversions, the rate is 5%. Always define the conversion first, because a lead form and a purchase produce very different rates from the same traffic.
Is a 2% conversion rate good?
A 2% conversion rate can be good or poor depending on context. For a high-ticket ecommerce purchase or a competitive Finance and Insurance keyword (2.78% average on Search), 2% is close to normal (WordStream, 2024). For a low-friction lead form, where medians sit near 8% to 9%, a 2% rate signals a targeting or landing-page problem.
If tracking conversion rate across Google, Meta, and TikTok has turned into a full-time manual job, Hawky's Performance Agent is built for that job.
Ready to hire your first AI performance team? Book Demo