TikTok Ads Benchmarks by Industry (2026 Data)
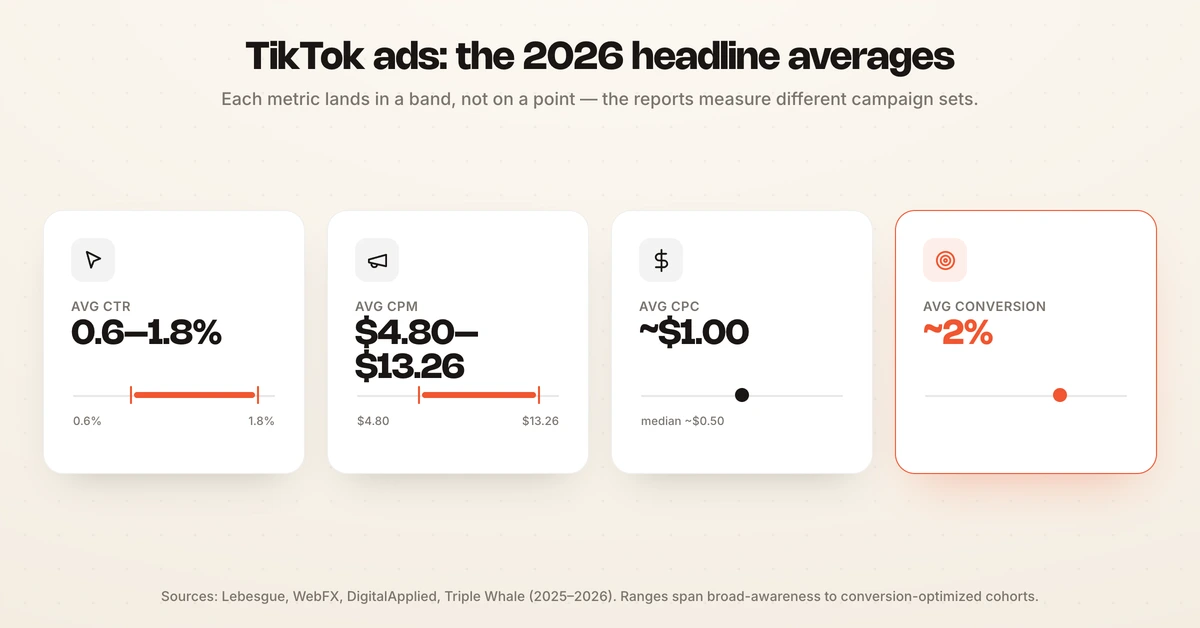
TikTok ads benchmarks in 2026 cluster around a 0.6% to 1.8% average click-through rate, a $4.80 to $13.26 CPM, a roughly $1.00 CPC, and a conversion rate near 2%, with wide swings once you split the numbers by industry and ad format.
Those ranges look loose because they are. No single figure is "the" TikTok benchmark. What you should measure against depends on your vertical, your ad format, your region, and whether the report counts every campaign or only conversion-optimized ones. This guide pulls current data from several 2026 sources, labels each figure with its origin, and builds the by-industry table you can actually hold your account to.
Read it as a floor and a ceiling, not a target. A beauty brand paying a $5.95 CPM and a finance advertiser paying $13.20 are both normal. The point of TikTok ads benchmarks 2026 is to tell you which of those two situations you are in.
What are the average TikTok ads benchmarks in 2026?
Average TikTok ads benchmarks land in a band, not on a point, because the major reports measure different campaign sets. Broad-targeting and awareness campaigns pull the average click-through rate down toward 0.6%, while conversion-optimized ecommerce cohorts push it past 1.7%. Reading all four together is more honest than trusting any one.
| Source (data year) | Avg CTR | Avg CPM | Avg CPC | Avg CVR | Avg CPA |
|---|---|---|---|---|---|
| Lebesgue (2026) | 0.61% | $4.80 | $0.20–$2.00 | 1.92% | n/a |
| WebFX (2024–25) | 0.84% | $9.16 | ~$1.00 | 0.46% (ecom) | n/a |
| DigitalApplied (Q1 2026, in-feed) | 1.0% | $9.16 | $1.02 | 1.8% | $56.67 |
| Triple Whale (2025, ecommerce) | 1.77% | $13.26 | n/a | 2.01% | $32.74 |
Two patterns hold across every source. TikTok stays cheaper on clicks than Meta, with a median CPC around $0.50 against roughly $1.72 on Facebook, per Lebesgue. And CPM is rising as more advertisers compete for the same inventory, up 16% year over year to $13.26 in Triple Whale's first-party ecommerce data.
If you want the plain-English versions of each metric before going deeper, the Hawky glossary defines CTR, CPM, CPC, CVR, and CPA in one place.
TikTok ads benchmarks by industry
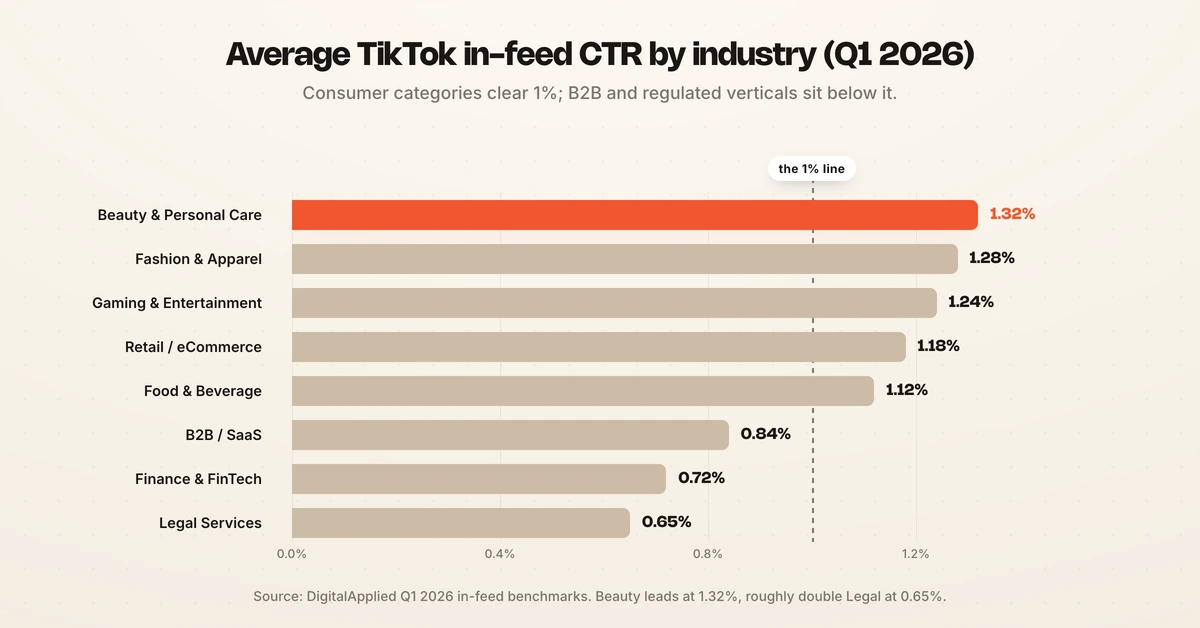
Industry is the single biggest driver of what "normal" looks like on TikTok. The table below uses DigitalApplied's Q1 2026 in-feed dataset, which draws on TikTok for Business reporting, the Statista Social Advertising Benchmark Database, and an agency composite of more than 1.2 million campaign impressions. It is the most complete single-source view because it carries CTR, CPM, CPC, CVR, and CPA together.
| Industry | CTR | CPM | CPC | CVR | CPA |
|---|---|---|---|---|---|
| Beauty & Personal Care | 1.32% | $5.95 | $0.74 | 2.62% | $28.21 |
| Retail / eCommerce | 1.18% | $5.40 | $0.79 | 2.45% | $32.24 |
| Fashion & Apparel | 1.28% | $6.42 | $0.86 | 2.31% | $37.23 |
| Gaming & Entertainment | 1.24% | $7.10 | $0.92 | 2.18% | $42.20 |
| Food & Beverage | 1.12% | $8.20 | $1.05 | 1.98% | $53.03 |
| Home Goods | 1.05% | $7.65 | $1.09 | 1.86% | $58.60 |
| Fitness & Wellness | 1.02% | $8.80 | $1.12 | 1.74% | $64.37 |
| Education & EdTech | 0.91% | $9.85 | $1.18 | 1.62% | $72.84 |
| Travel & Hospitality | 0.98% | $10.40 | $1.21 | 1.51% | $80.13 |
| Auto & Auto Parts | 0.94% | $10.95 | $1.28 | 1.42% | $90.14 |
| B2B / SaaS | 0.84% | $11.42 | $1.34 | 1.28% | $104.69 |
| Healthcare | 0.78% | $12.15 | $1.47 | 1.14% | $128.95 |
| Finance & FinTech | 0.72% | $13.20 | $1.71 | 1.02% | $167.65 |
| Legal Services | 0.65% | $14.10 | $1.92 | 0.88% | $218.18 |
The verticals split cleanly into two camps. Visual, impulse-friendly categories such as beauty, fashion, and retail earn the highest CTRs and the lowest CPAs, because the content native to TikTok already sells the product. High-consideration and regulated categories such as finance, healthcare, and legal pay two to three times more per action, both because inventory is pricier and because the buying decision rarely closes on a first tap.
Notice how the metrics move together down the table. As CPC climbs from $0.74 to $1.92, CTR falls and CPA balloons from $28.21 to $218.18. That correlation is the useful part: it tells you a weak CPA is usually a symptom of a weak hook, not just an expensive audience.
What is a good CTR for TikTok Ads?
A good CTR for TikTok ads is 1.0% or higher, with anything above 1.5% considered excellent and anything below 0.5% a signal that the creative or the audience is off. For ecommerce specifically, the typical in-feed CTR sits between 0.9% and 1.2%, while top brands clear 2.0%, according to TikAdSuite. Use those numbers as the tiktok ads ctr benchmark for standard in-feed placements.
Ad format changes the math completely. Premium takeover placements buy attention that in-feed cannot, so their click-through rates are not comparable to a standard feed ad.
| Ad format | Typical CTR |
|---|---|
| In-Feed (standard) | 0.84%–1.0% |
| Spark Ads | 2.4% |
| Branded Effects | ~8% |
| TopView | 12%–16% |
Spark Ads figures come from DigitalApplied, and the branded and TopView numbers from WebFX. The lesson holds across sources: judge your average CTR for TikTok ads against the format you are actually running, not the platform-wide mean. A 1.1% in-feed CTR is strong, while the same 1.1% on a TopView buy would be a red flag. For the cross-platform view, see how these compare in what is a good CTR.
TikTok ads CPM by industry: what you pay for reach
TikTok ads CPM by industry ranges from roughly $5 in visual retail categories to more than $14 in finance and legal, and the gap has widened as competition rose. DigitalApplied's in-feed data puts beauty at $5.95 and finance at $13.20, while TikAdSuite reports a similar spread, with finance and insurance at $11.00 to $14.50 and health and fitness near $6.50.
Region and format move CPM as much as industry does. TikAdSuite puts US and Canada inventory at $10 to $15, UK and Germany at $6 to $9, and Southeast Asia at $1 to $3. On format, standard in-feed runs $4 to $10, Spark Ads $5 to $9, and TopView $10 to $20 or a flat $50,000 to $150,000 per day for the largest takeovers.
The practical read is that a rising CPM is not automatically bad. If CPM climbs but CPA holds, you are simply paying more for reach that still converts. The tiktok ads cost breakdown covers how these inputs roll up into total spend, and what is a good CPM sets the cross-channel context.
What is a good TikTok ads conversion rate?
A good TikTok ads conversion rate sits between 2% and 3%, with anything above 3% strong and anything below 1.5% a sign that the landing page, offer, or audience needs work, per TikAdSuite. The platform average lands close to 2%, whether you take Lebesgue's 1.92% or Triple Whale's 2.01%.
The Triple Whale dataset is worth studying on its own because it comes from a first-party ecommerce cohort and adds ROAS, which the format-level reports leave out. It also tells a pointed story: across 2025, TikTok CTR rose 13.74% while CVR fell 6.2%, meaning audiences clicked more but bought less. That points the tiktok ads conversion rate problem at the post-click experience, not the ad.
| Industry (ecommerce) | CVR | CTR | CPM | CPA | ROAS |
|---|---|---|---|---|---|
| Apparel & Accessories | 2.37% | 0.69% | $4.24 | $21.85 | 2.49 |
| Home & Garden | 2.42% | 0.68% | $5.69 | $21.36 | 1.97 |
| Toys, Art & Collectibles | 2.38% | 0.58% | $4.56 | $20.94 | 1.55 |
| Beauty | 2.19% | 0.58% | $5.28 | $18.82 | 0.74 |
| Food & Beverage | 2.17% | 0.58% | $6.33 | $19.84 | 0.49 |
| Lifestyle & Boutique | 2.16% | 0.57% | $4.25 | $25.43 | 1.88 |
| Pets & Animals | 1.91% | 0.49% | $5.21 | $13.46 | 0.08 |
| Electronics | 1.85% | 0.73% | $5.17 | $31.25 | 1.68 |
| Health & Wellness | 1.68% | 0.57% | $5.34 | $16.87 | 0.72 |
| Sports & Outdoors | 1.49% | 0.52% | $3.79 | $19.83 | 1.39 |
Source: Triple Whale, full-year 2025 ecommerce cohort. Notice that a healthy CVR does not guarantee a healthy ROAS. Food and beverage converts at 2.17% yet returns only 0.49x, because low average order values cannot cover the media cost. For the broader baseline across channels, compare against average ad conversion rate.
Why TikTok ads benchmarks vary so much between reports
TikTok ads benchmarks disagree across reports because each publisher measures a different population. That is not sloppiness, it is scope, and understanding the scope tells you which number to trust for your account.
- Campaign set. Platform-wide averages include awareness and reach campaigns that never optimized for a click, which drags CTR toward 0.6%. Conversion-optimized ecommerce cohorts strip those out and report closer to 1.8%.
- Attribution and window. A 7-day-click model and a 1-day-view model will report different conversion rates from the same spend. First-party tools like Triple Whale read the store's own data, while platform figures read TikTok's.
- Region and time. US inventory can cost double what UK inventory costs, and Q4 CPMs run hot. A benchmark with no date or geography is close to useless.
The takeaway is to match a benchmark to your own setup before reacting to it. A single blended number treated as gospel will send you chasing the wrong lever. This is also why manual benchmark-watching struggles: the reference point moves faster than a weekly report can track.
How to beat TikTok ads benchmarks, not just watch them
Benchmarks describe the market, they do not fix your account. The gap between a $28 beauty CPA and a $53 food-and-beverage CPA is closed by faster iteration on hooks, formats, and audiences, not by staring at a table. That work is continuous, and it is where most teams run short on hours.
This is the job Hawky's Performance Agent was built to run. It operates Meta, Google, YouTube, and TikTok campaigns against your KPI around the clock, testing creative and reallocating budget on its own, with every move logged with trigger data and a confidence score and reversible in one click. The autonomy is configurable: you set the gate at every campaign, every brand, or none, and loosen it as trust builds, so the automation stays inside guardrails you control.
The Command Center is where that plays out in view. It scores every creative, flags underperformers against your own benchmark the moment they slip, and ranks the next actions by expected impact, so a rising CPA surfaces as a task before it drains the budget. Instead of comparing last week's numbers to a static industry average, the Command Center measures live performance against the KPI you locked and moves on it. For how that maps to spend and plans, see pricing, and for the tactical playbook read TikTok ads optimization.
For context on how TikTok stacks up against other channels, the same benchmarking approach applies to Facebook ads benchmarks, Google ads benchmarks, and what is a good CPC.
Frequently asked questions
What is a good CTR for TikTok Ads?
A good CTR for TikTok ads is 1.0% or higher for standard in-feed placements, with 1.5% and above rated excellent and below 0.5% a warning sign, per TikAdSuite. Premium formats sit far higher, with Spark Ads near 2.4% and TopView between 12% and 16%, so always judge your CTR against the format you are running.
What is the average CPM on TikTok?
The average CPM on TikTok in 2026 falls between roughly $4.80 and $13.26 depending on the report, industry, and region. Lebesgue reports $4.80 across broad campaigns, DigitalApplied and WebFX cite $9.16 in-feed, and Triple Whale's ecommerce cohort reports $13.26. Finance and legal sit at the top of the range, beauty and retail at the bottom.
What is a good TikTok conversion rate?
A good TikTok conversion rate is 2% to 3%, with above 3% strong and below 1.5% a sign that the landing page or offer needs work, according to TikAdSuite. The platform average sits near 2.0%, and top ecommerce categories such as apparel and home goods clear 2.4% in Triple Whale's 2025 data.
What is the average CPC for TikTok ads?
The average CPC for TikTok ads runs about $1.00, with a median closer to $0.50 that makes TikTok cheaper per click than Facebook, per Lebesgue and DigitalApplied. By industry it spans $0.74 in beauty to $1.92 in legal services.
Are TikTok ads cheaper than Facebook ads?
On a per-click basis, yes. TikTok's median CPC of around $0.50 undercuts Facebook's $1.72 and Instagram's $3.56, per Lebesgue. Whether that lower click cost turns into lower CPA depends on your conversion rate and average order value, which is why the by-industry CVR and ROAS figures matter more than headline CPC.
If your TikTok benchmarks move faster than your team can react to them, Hawky's Performance Agent is built for that job.
Ready to hire your first AI performance team? Book Demo