ROAS vs ROI: What Each Metric Measures and When to Use Each
ROAS measures how much revenue an ad campaign returned per dollar of ad spend, and ROI measures how much profit an investment returned after all costs. ROAS vs ROI is not a choice between a better and a worse metric: ROAS judges a campaign, ROI judges a business, and a campaign can post a strong ROAS while losing money.
The two get confused because they look like the same calculation. Both divide a return by a cost. The difference sits in what each one counts as the return and what it counts as the cost, and that difference is what decides whether a 4x ROAS is a good quarter or an expensive one.
This guide covers both formulas, the one calculation that converts between them, a worked example where the two metrics disagree, and the question neither of them answers.
What is ROAS?
ROAS, or return on ad spend, is the revenue attributed to an advertising campaign divided by the cost of that campaign. It is an efficiency ratio for media buying, and it counts nothing outside the ad account.
The formula is:
ROAS = Revenue from ads ÷ Ad spend
Spend $10,000 on Meta and attribute $40,000 of revenue to it, and the ROAS is 4.0, usually written as 4x or 4:1. Shopify documents the same calculation for merchants, and Meta defines purchase ROAS as the total return on the purchases attributed to your ads.
One convention trips people up constantly. Google Ads expresses the figure as a percentage rather than a multiple. In Google's own Target ROAS documentation the example reads "$5 USD in sales ÷ $1 USD in ad spend x 100% = 500% target ROAS".
A 500% target ROAS in Google Ads and a 5x ROAS in a board deck are the same number. If a target looks absurd by a factor of a hundred, that is why. The full definition lives in the ROAS glossary entry.
Because the denominator is only ad spend, ROAS is the natural unit for decisions inside an ad account. Which campaign gets more budget, which ad set gets paused, which creative earns another week.
What is ROI?
ROI, or return on investment, is the profit generated by an investment divided by the total cost of that investment. It counts every cost, not only media, and it uses profit rather than revenue.
The marketing form of the formula is:
ROI = (Gross profit − Marketing cost) ÷ Marketing cost × 100
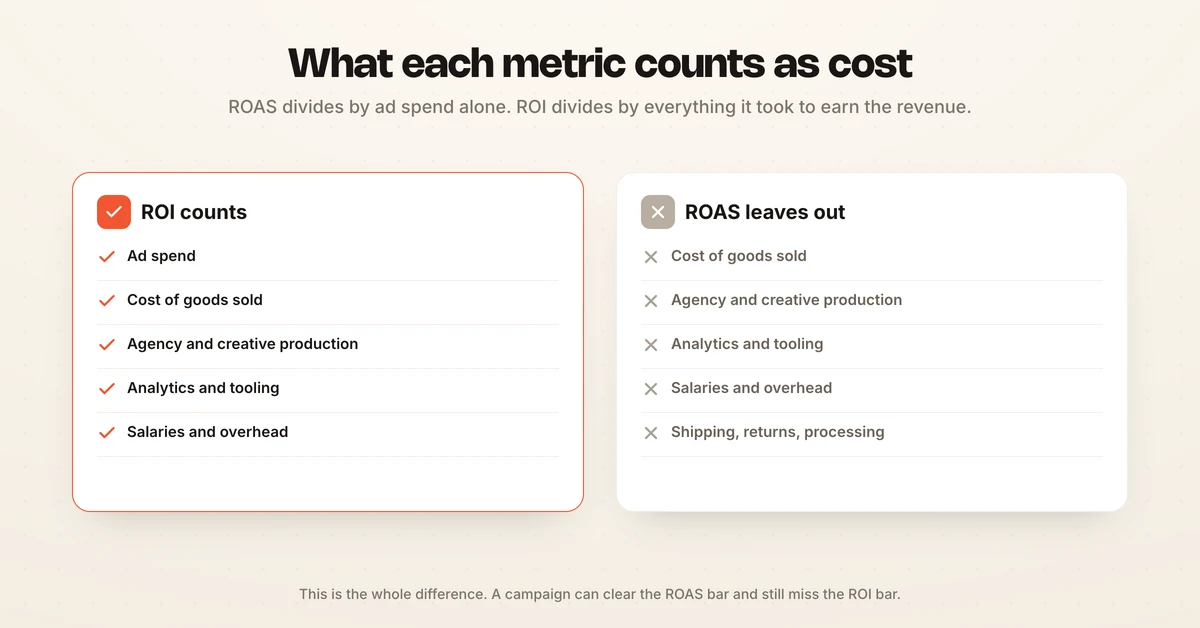
The costs that belong in the denominator are the ones ROAS ignores: cost of goods sold, agency retainers, salaries, creative production, software subscriptions, shipping, payment processing and returns. ROI is expressed as a percentage, and it can be negative. ROAS cannot.
That single structural difference is the whole comparison. ROAS asks whether the media buy was efficient. ROI asks whether the business made money.
ROAS vs ROI: the core differences
ROAS and ROI differ on four things: what they count as return, what they count as cost, what scope they cover, and who uses them.
| ROAS | ROI | |
|---|---|---|
| Measures | Revenue per dollar of ad spend | Profit per dollar of total investment |
| Numerator | Attributed revenue | Gross profit minus marketing cost |
| Denominator | Ad spend only | All costs: COGS, salaries, agency, tooling, production |
| Expressed as | A multiple (4x) or percentage (400%) | A percentage, which can be negative |
| Scope | Campaign, ad set, creative | Channel, quarter, whole business |
| Answers | Is this campaign efficient? | Did this make money? |
| Used by | Media buyers, performance teams | Finance, founders, CMOs |
| Available | In the ad platform, near real time | After margin and cost data close |
The practical consequence is that the two metrics operate on different clocks. ROAS updates through the day inside Meta and Google Ads. ROI usually arrives after the month closes, once margin and overhead are known. Teams optimise daily on the metric that is available and report quarterly on the metric that is true.
The formula that connects ROAS and ROI
Break-even ROAS is the bridge between the two metrics, and it is a single division: 1 ÷ gross margin.
Gross margin is the share of each sale left after cost of goods. A brand selling at a 40% margin keeps $0.40 of every revenue dollar, so it needs $2.50 of revenue to cover $1.00 of ad spend. That is a break-even ROAS of 2.5x. Anything above it contributes profit, anything below it burns cash however healthy the multiple looks.
| Gross margin | Break-even ROAS | A 4x ROAS is |
|---|---|---|
| 20% | 5.0x | Losing money |
| 25% | 4.0x | Exactly break-even |
| 30% | 3.33x | Thin profit |
| 40% | 2.5x | Healthy |
| 50% | 2.0x | Strong |
| 70% | 1.43x | Very strong |
| 85% | 1.18x | Excellent |
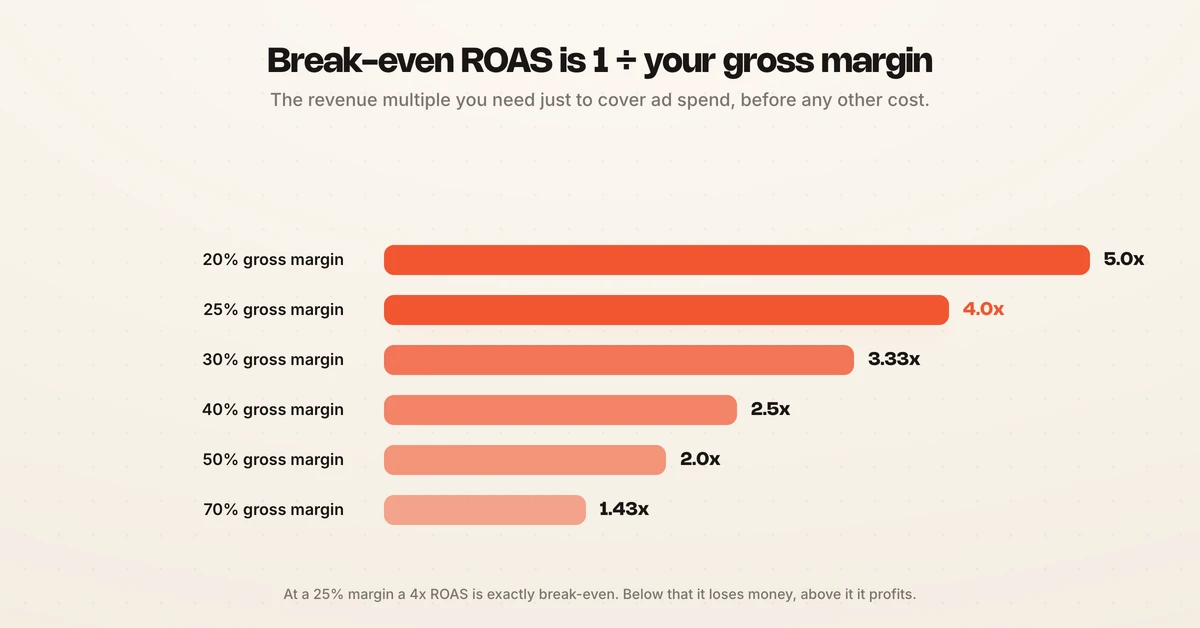
Read that table once and the headline ROAS number stops meaning anything on its own. A 4x return is a loss at a 20% margin and excellent at 70%. Run your own figure through the break-even ROAS calculator before setting a target in the ad platform.
This is also why "what is a good ROAS" has no universal answer. The benchmark is your margin, not an industry average, which the guide to what counts as a good ROAS covers in more detail.
A worked example where ROAS and ROI disagree
The clearest way to see the gap is to run one month through both formulas. Take a D2C brand spending $50,000 on Meta and Google, attributing $200,000 in revenue, at a 30% gross margin.
By ROAS:
$200,000 ÷ $50,000 = 4.0x. A number most performance teams would be happy to report.
By ROI, with the costs ROAS leaves out:
| Line | Amount |
|---|---|
| Attributed revenue | $200,000 |
| Cost of goods sold (70%) | −$140,000 |
| Gross profit | $60,000 |
| Ad spend | −$50,000 |
| Agency and creative production | −$12,000 |
| Analytics and tooling | −$3,000 |
| Net contribution | −$5,000 |
ROI = (−$5,000) ÷ $65,000 × 100 = −7.7%.
The same month reads as a 4x success and a loss. Nothing was miscounted. The break-even ROAS at a 30% margin is 3.33x on media alone, and once the agency, production and tooling costs enter the denominator the real break-even rises past 4x. The campaign cleared the first bar and missed the second.
This is the failure mode the comparison exists to prevent. A team that reports only ROAS scales a campaign that is quietly consuming margin, and the problem surfaces when finance closes the quarter.
Is a 4x ROAS good? And 3.0, and 20?
None of those numbers is good or bad until it is set against a margin, which is the short answer to the most common questions about ROAS thresholds.
- Is a 4 ROAS good? Above a 25% gross margin, yes. At or below 25%, a 4x return is break-even or a loss. For most D2C brands running 30% to 50% margins, 4x is a healthy result.
- Is 3.0 ROAS good? It clears break-even for any business above a 33.3% margin. For software and digital products at 70% or higher it is comfortable; for hardware or apparel at 25% it is losing money.
- Is 20 a good ROAS? A 20x return is exceptional and worth interrogating before celebrating. In practice it usually signals branded search capturing demand that already existed, a retargeting pool converting people who were going to buy anyway, or double-counted conversions. Genuine 20x returns on cold prospecting are rare.
The pattern across all three is the same: the multiple is meaningless without the margin. Platform and category averages are useful only as a sanity check, and ROAS benchmarks by industry and the ecommerce ROAS benchmarks give the ranges worth comparing against.
When to use ROAS and when to use ROI
Use ROAS for decisions inside the ad account and ROI for decisions about the business. The two are complements, and the mistake is using one where the other belongs.
Reach for ROAS when:
- Comparing campaigns, ad sets or creatives against each other on the same product and margin
- Setting bid targets, since Google and Meta both optimise toward a ROAS goal natively
- Making intraday or intraweek calls on budget, pausing and scaling
- Judging creative performance, where the cost structure is identical across variants
Reach for ROI when:
- Deciding whether a channel deserves budget next quarter
- Comparing paid media against a spend that is not media, such as a hire or a new tool
- Reporting to finance, a board or investors
- Working across products whose margins differ enough to make a shared ROAS target meaningless
The reason ROAS dominates day to day is availability, not superiority. It exists in the platform the moment spend starts, while ROI waits on margin and overhead. The healthy setup is a margin-derived break-even ROAS used as the daily target, with ROI confirming monthly that the target was set correctly.
What neither ROAS nor ROI tells you
Neither metric measures incrementality, which is whether the revenue would have arrived without the ad. Both take attributed revenue as given, and attribution is reported by the platform that sold you the click.
Meta and Google each count the same purchase as their own win, so the sum of platform-reported revenue routinely exceeds actual revenue. Meta runs its own attribution system and Google runs another, and neither deducts what the other already claimed.
The attribution model you choose changes both metrics without a single thing changing in the account. Google defines a model as "a rule, a set of rules, or a data-driven algorithm that determines how credit is assigned to touchpoints", and switching from last click to data-driven redistributes the same conversions across different channels. A ROAS built on that number inherits whichever rule was selected, and an ROI built on the same figure inherits it too, one layer further down.
Branded search is the clearest case. It posts extraordinary ROAS because it captures people already searching for you, most of whom would have arrived through an organic result at no media cost. The reported return is real; the incremental return is a fraction of it.
The test that settles it is a holdout: suppress ads for a defined audience or geography, and compare. Incrementality testing measures the lift the spend actually caused rather than the conversions it managed to claim, and the guide to incrementality in marketing covers how to run one. Treat ROAS as a steering metric, ROI as a scoring metric, and incrementality as the audit on both.
How to track both without rebuilding a spreadsheet every month
Tracking both metrics properly needs one thing the ad platform does not have: your cost data. Margin, COGS, agency fees and tooling live outside the account, so the join has to happen somewhere else.
Three practical steps cover most of it:
- Derive your break-even ROAS from margin and set that as the platform target, rather than inheriting a 3x rule of thumb from an article.
- Feed conversion data back first-party. Server-side events give the bidding models better signal than the pixel alone, which moves performance more reliably than better reporting does.
- Separate prospecting from retargeting and branded search before judging any blended number, because a blended ROAS hides exactly the campaigns worth questioning.
The gap most teams hit is speed. Knowing on the 5th of the month that last month's 4x was a loss does not recover the spend. Hawky's Performance Agent operates against the KPI you set, including a margin-derived ROAS or CAC target, reallocating and pausing while the month is still running, with guardrails, an audit trail and a rollback on every move. Hawky reports an average 25% ROAS uplift within 90 days on the accounts it operates.
Frequently asked questions
Is ROAS the same as ROI?
No. ROAS divides attributed revenue by ad spend and measures campaign efficiency, while ROI divides profit by total investment and measures whether money was made. ROAS counts only media cost in the denominator, so it ignores cost of goods, salaries, agency fees and tooling. A campaign can post a positive ROAS and a negative ROI in the same month.
What is the formula for ROAS vs ROI?
ROAS is revenue from ads divided by ad spend, expressed as a multiple such as 4x or, in Google Ads, as a percentage such as 400%. Marketing ROI is gross profit minus marketing cost, divided by marketing cost, multiplied by 100, and it is always a percentage. The bridge between them is break-even ROAS, which equals 1 divided by your gross margin.
Which is more important, ROAS or ROI?
ROI is the more complete measure because it accounts for every cost and tells you whether the business profited. ROAS is the more useful daily metric because it updates in real time inside the ad platform and isolates media performance from everything else. Use a margin-derived break-even ROAS as the operating target and confirm it monthly with ROI.
Can you have a good ROAS and still lose money?
Yes, and it is common at low margins. A 4x ROAS at a 20% gross margin loses money, because break-even at that margin is 5x. Adding agency fees, creative production and tooling raises the real break-even further, so a campaign that clears the media-only bar can still finish the month negative.
How do you convert ROAS to ROI?
Multiply your ROAS by your gross margin to find revenue-to-cost coverage, then subtract the non-media costs. A 4x ROAS at a 35% margin returns $1.40 of gross profit per dollar of ad spend, which is $0.40 of contribution before agency, production and tooling costs are deducted. Once those exceed $0.40 per dollar of spend, ROI turns negative.
What is a good marketing ROI?
A 5:1 revenue-to-cost ratio circulates widely as the target, but it is industry lore rather than a researched figure, and it breaks down the moment margins differ. A software company at an 85% margin and an apparel brand at 25% cannot share a target. The defensible answer is your own break-even: derive it from gross margin, then judge every channel against that rather than against a published average.
ROAS tells you the campaign was efficient. ROI tells you the quarter was profitable. The expensive gap is the weeks between the two, when the spend that will show up as a negative ROI is still running at what looks like a healthy 4x. If your margin-adjusted target is only enforced after the month closes, Hawky's Performance Agent is built for that job.
Ready to hire your first AI performance team? Book Demo