What is the Data and infographic ad format?
Numbers, charts or a statistic used as the central claim. It appears in 988 of the 7,00,232 classified creatives in this library, run by 134 different advertisers.
A number, a chart or a statistic is the creative's central claim. The rarest format in this library by an order of magnitude, run by few advertisers and lightly even by them, which is itself information: quantified argument is advertising's least-used move.
How it sits in the corpus
By volume this is the smallest of the 20 formats in the library: 988 creatives, under 1% of everything classified.
Only 134 of the 1,103 advertisers analysed (12%) run it at all, which makes it one of the less contested moves in the library: harder to execute, but with far less same-looking competition in the feed.
Where it is run, it is run lightly: an average of 7 creatives per advertiser, under the cross-format median of 49. Most brands use it for moments rather than as an always-on engine.
The most telling number is the video share. The archetype is static, yet 65% of it now ships as video: advertisers are re-cutting a print-native idea into motion, and the variants below show what those video versions look like.
When to use it
Rational categories where a single figure outperforms any adjective.
A specific number does what adjectives cannot: it is checkable, comparable and hard to argue with, and precision is read as honesty even before verification. In rational, high-consideration categories a single figure ('47% fewer breakdowns') outperforms any superlative because it converts the brand's claim into the buyer's own inference; the viewer does the persuading themselves, from the data.
Anatomy of a good one
The structural parts a competent data and infographic always has, and what each is for.
A single statistic as the visual hero, set at display size. The number is the headline, the image and the argument at once.
Against the average, the before, the rival category. A number without a baseline is a mood.
Who measured it, when, on how many. Small type, non-negotiable; an unsourced statistic is a slogan in a lab coat.
The chart or graphic that makes the gap legible in half a second. The form is chosen for the phone screen, not the boardroom.
One line translating the figure into the buyer's outcome. Data selects the believers; the translation tells them what to do.
The figure stated in something the buyer feels: hours saved, rupees kept, kilometres added. Percentages impress; felt units persuade.
Craft rules
- 01
One statistic per ad. The format's power is focus; a dashboard is not a message.
- 02
Choose the number the buyer would repeat to someone else; the best data creative is a portable fact.
- 03
Source it visibly and survivably: the citation will be checked precisely because the format invites checking, and one bad number retires the brand's right to the format.
- 04
Design the figure, not around it. The digits themselves, typeset huge, usually beat any chart; use a chart only when the shape of the gap is the story.
- 05
Round for memory, keep precision available: '3x faster' on the creative, the measured figure in the source line.
How it goes wrong
The chart nobody asked for: visualising data that has no gap, no baseline and no stakes, which is decoration with axes.
Vague authority ('studies show', 'research says') doing the work a named source should, which converts the format's honesty signal into its opposite.
Cramming; an infographic with six statistics is a report, and the feed does not read reports.
The shapes it takes
One label, several distinct executions. The variants are worth testing as separate ads, because the platform will price them differently.
The statistic typeset as the entire creative. The purest and usually strongest shape.
One bar or line comparison, brutally simplified. For when the gap's shape argues better than its size.
'X% of users say': proof borrowed from the crowd, overlapping social proof but arguing with the number rather than the stars.
The figure counting up or the gap drawing itself in video, which is where this format's unexpectedly large video share lives.
When it wears out
The number outlives the ad but not the measurement: data creative expires when its figure ages or a rival publishes a better one. Refresh the statistic on a research calendar, and treat each new measured win as a new campaign the format is already built for.
What to run alongside it
Who runs this format
134 advertisers run this format. Of the brands with a page in this library, Stripe runs it hardest, with 59 creatives in this shape.
- Stripe59 creatives
- Wise48 creatives
- Kotak Neo34 creatives
- Coursera27 creatives
- Simplilearn23 creatives
- Canva21 creatives
- ICICI Prudential Life Insurance19 creatives
- Policybazaar18 creatives
- Wellbeing Nutrition18 creatives
- Newton School17 creatives
- Payoneer16 creatives
- OZiva15 creatives
- Great Learning14 creatives
- Intellipaat14 creatives
- 5paisa10 creatives
- Joinditto8 creatives
- Angel One7 creatives
- PayPal7 creatives
- Wint Wealth6 creatives
- 1mg4 creatives
- Aisle4 creatives
- Coding Ninjas4 creatives
- Caraway4 creatives
- Skydo4 creatives
- Vedantu3 creatives
- Masters' Union2 creatives
- Payu2 creatives
- Tinder2 creatives
- Hinge2 creatives
- Wooden Street2 creatives
- Traya2 creatives
- Function Health2 creatives
- NxtWave1 creatives
- Tataaia1 creatives
- Adyen1 creatives
- Beardo1 creatives
- ICICI Lombard1 creatives
- Myjar1 creatives
- The Derma Co.1 creatives
- Radisson1 creatives
- MasterClass1 creatives
- GoKwik1 creatives
- Manmatters1 creatives
- Jeevansathi1 creatives
- Superpower1 creatives
- HDFC Life1 creatives
- Outskill1 creatives
Data and infographic ads in the wild
15 real creatives carrying this format, drawn from across the advertisers analysed. Video entries show their opening frame.









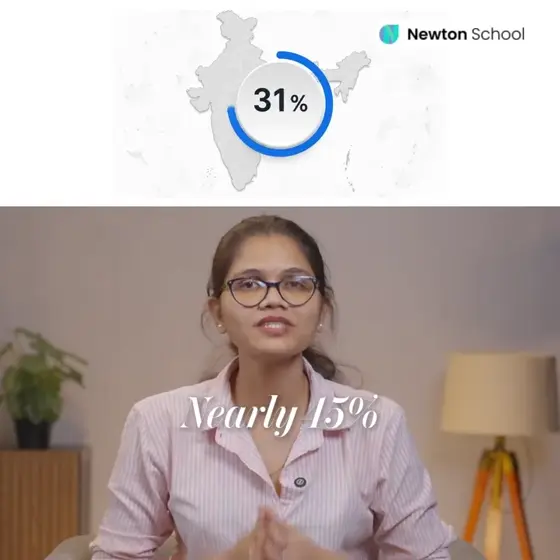



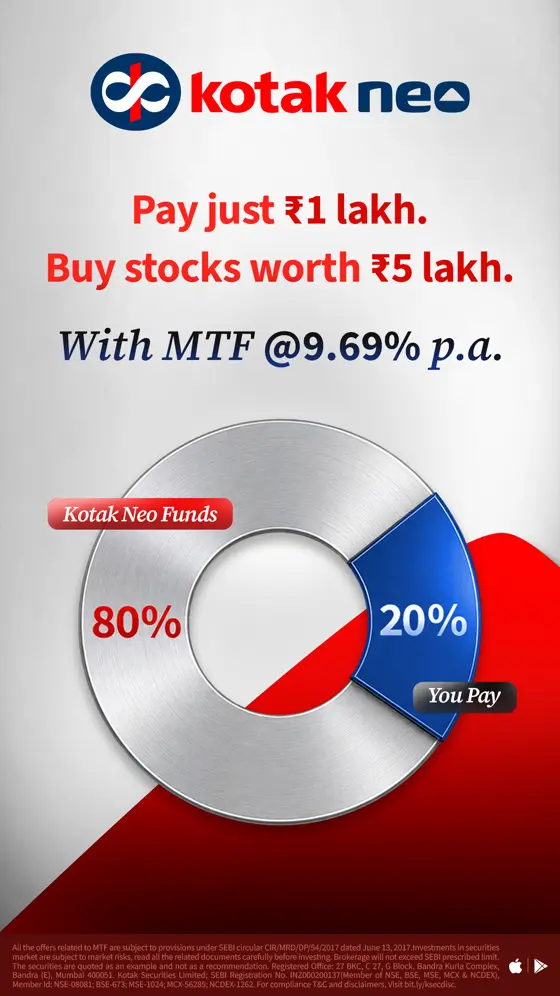
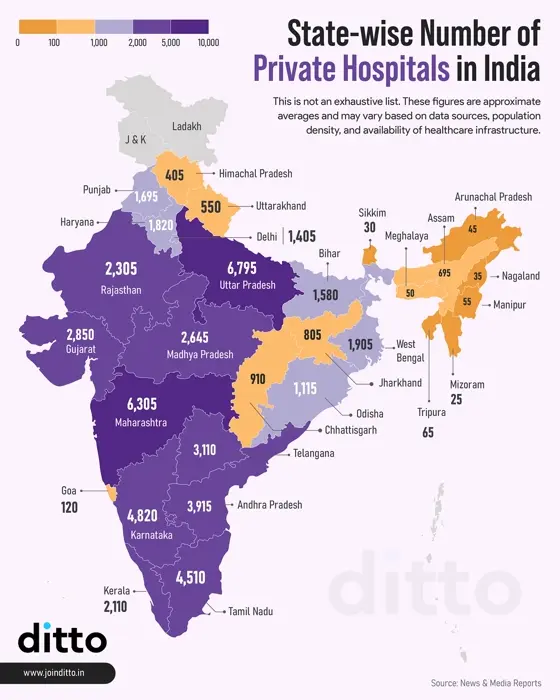
Other formats
Sourced from public ad libraries. The source data carries no visual-format field, so this format is assigned by matching each creative's own description against the taxonomy's vocabulary, which makes the counts indicative rather than exact. Brand pages currently cover the two-wheeler and EV set for Aug 24, 2025 → Aug 24, 2026; the format count above spans every advertiser analysed.